Fossil Fuel Burn for US Electricity
Daily oil, gas and coal burn for US power by grid region, from EIA-930 fuel-mix data. Conversion conventions are printed on each chart.
Interactive: Fuel Mix Since 2001 & Daily Fossil Burn
Monthly US generation share by fuel since 2001, and daily oil/gas/coal burn since 2018 with named winter storms. Hover, zoom, drag the range slider.
Northeast Weather-Driven Oil Demand — Homes + Power Plants
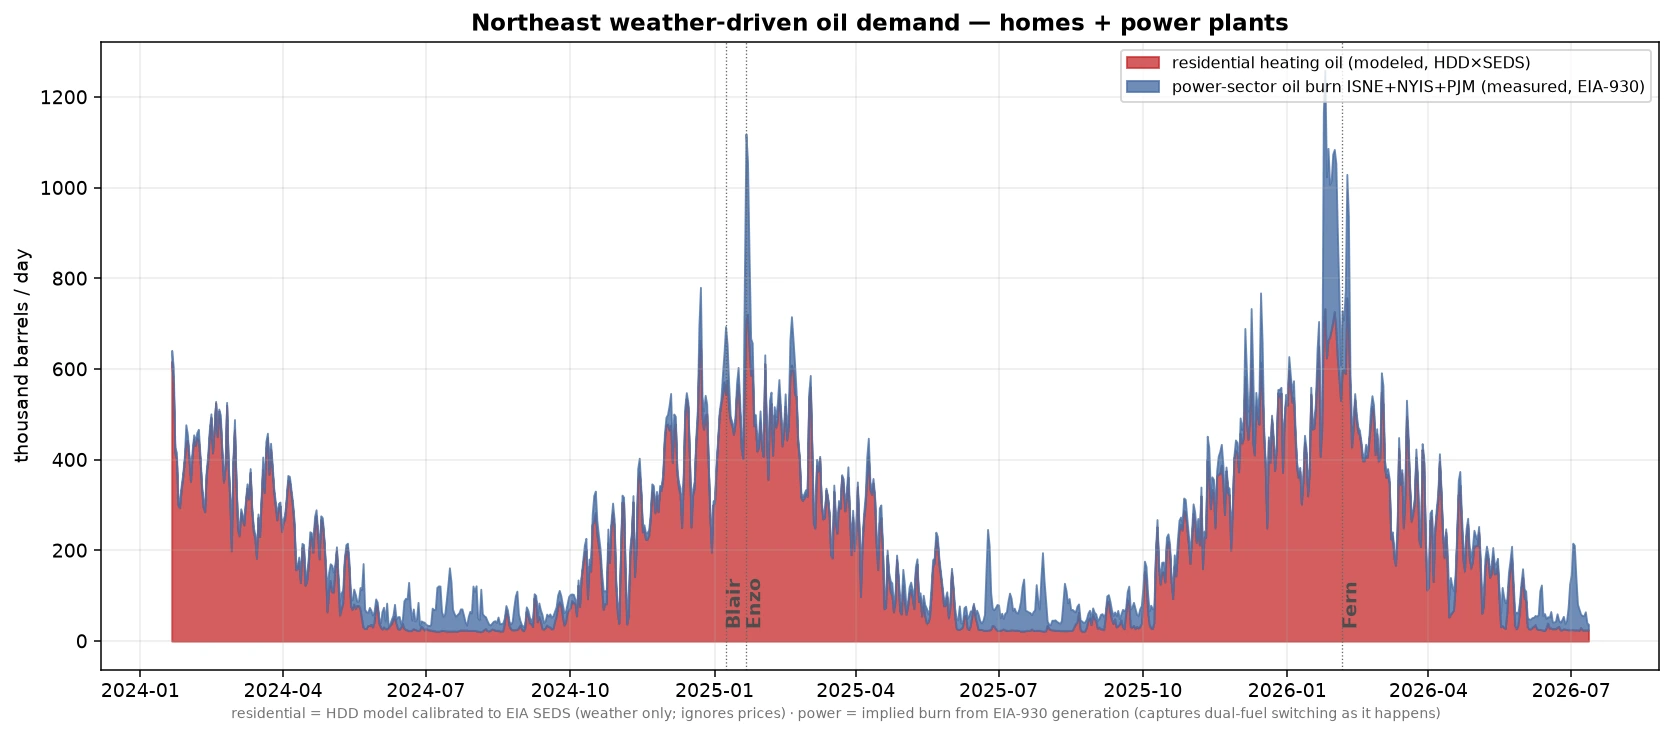
The two ways the Northeast burns oil when it gets cold, on one axis: the modeled residential heating-oil estimate (red, HDD × SEDS calibration) stacked with the measured power-sector burn in ISO-NE, NYISO and PJM (blue, implied from EIA-930 generation — this piece captures dual-fuel switching as it actually happens, prices and all). Cold snaps light up both at once.
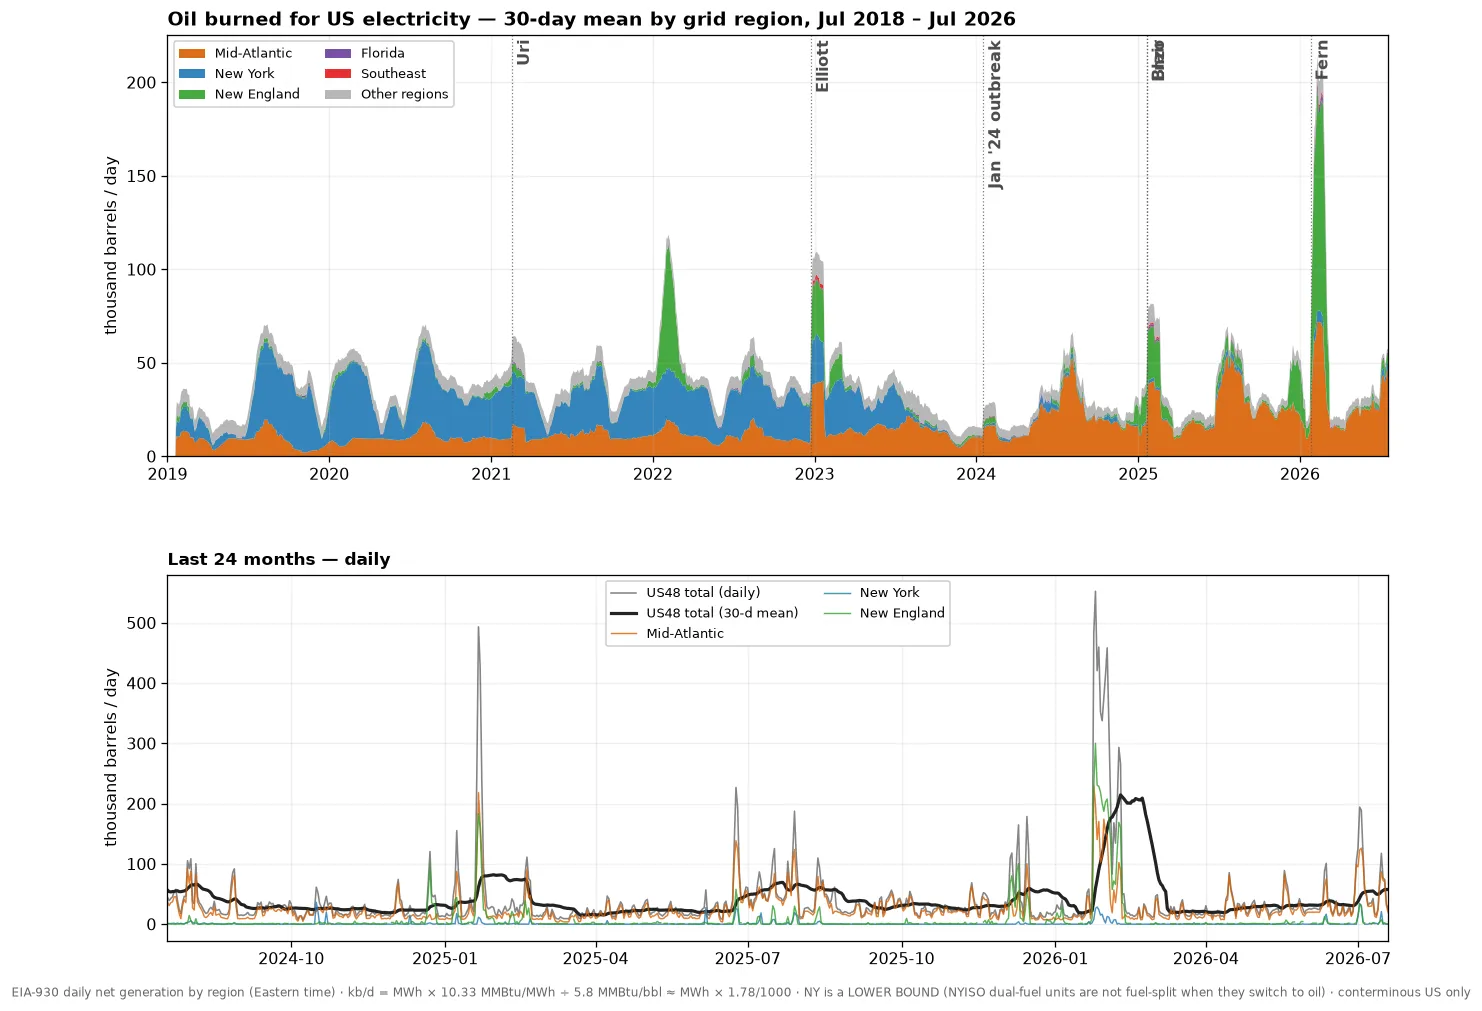
Oil Burned for Electricity — Thousand Barrels per Day
EIA-930 daily petroleum generation by grid region, as implied barrels burned.
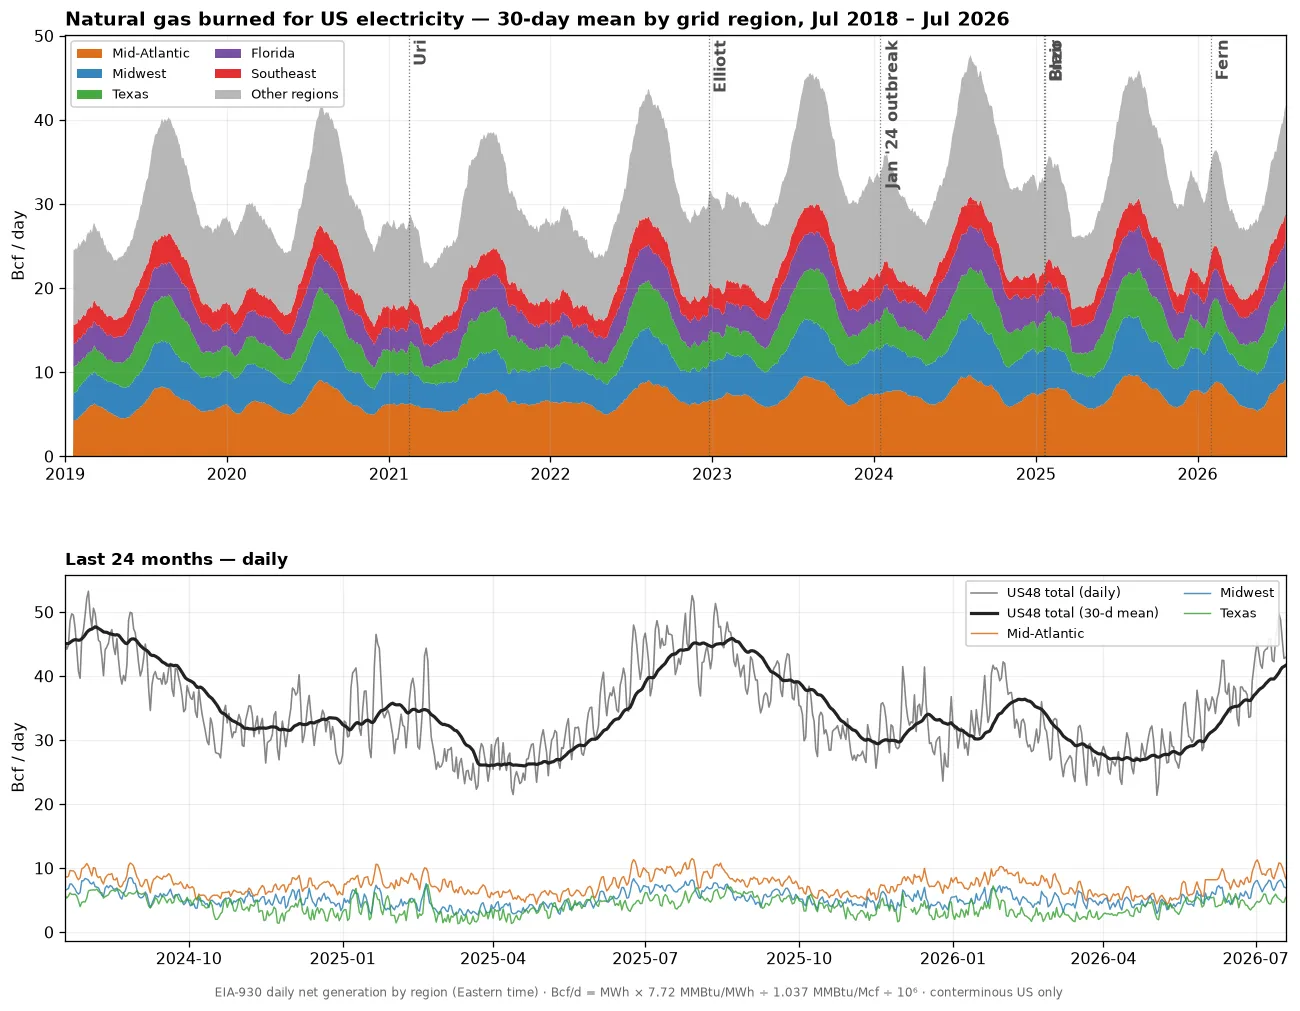
Natural Gas Burned for Electricity — Bcf per Day
EIA-930 daily natural-gas generation by grid region, as implied gas burn.
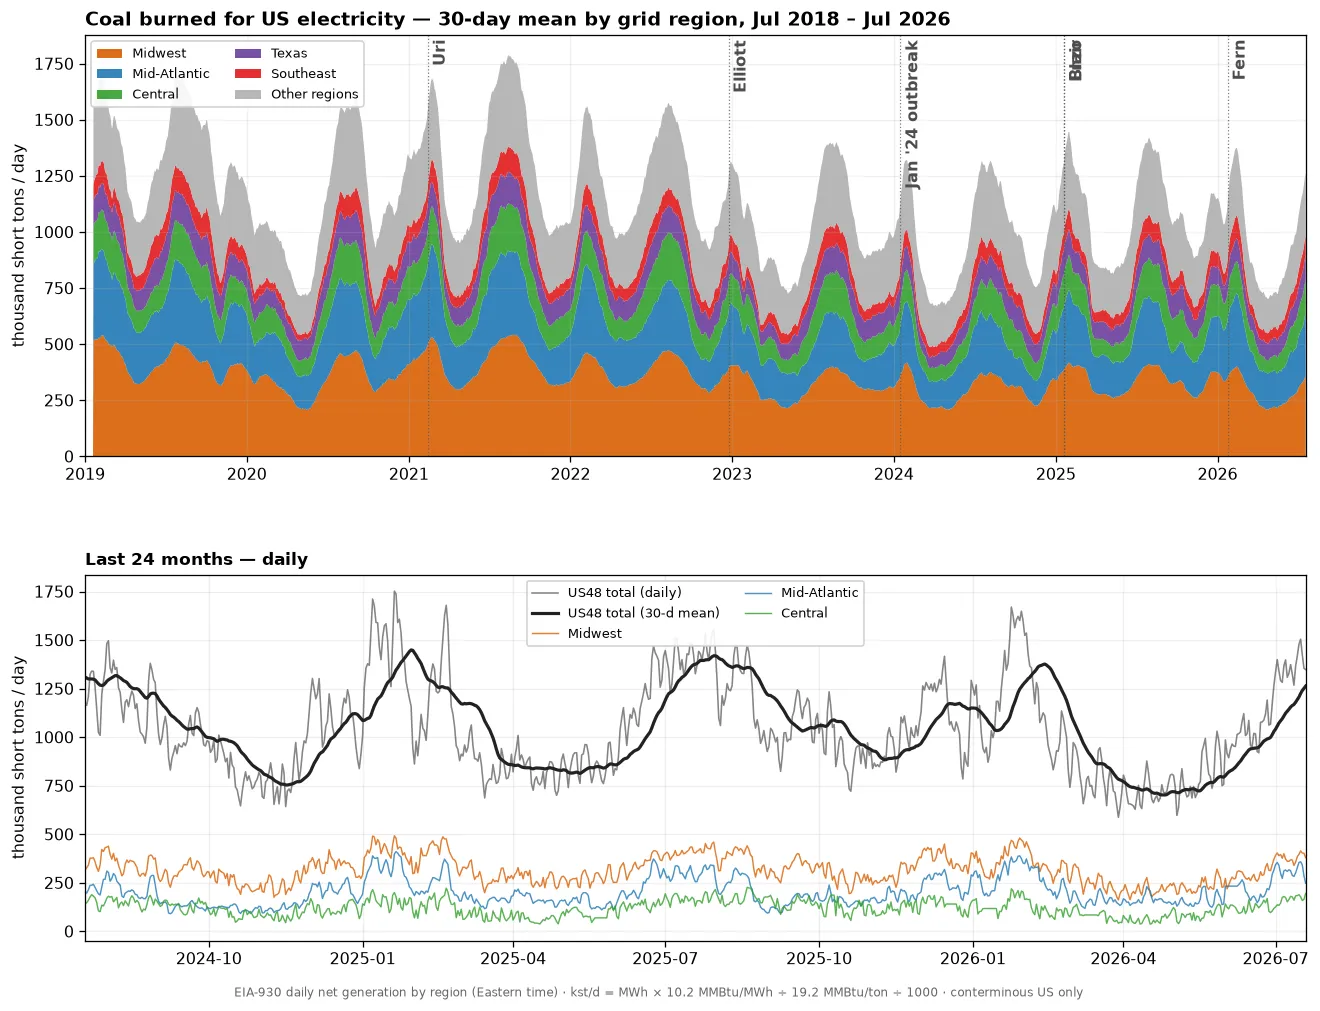
Coal Burned for Electricity — Thousand Short Tons per Day
EIA-930 daily coal generation by grid region, as implied tons burned.
Where America Heats with Oil
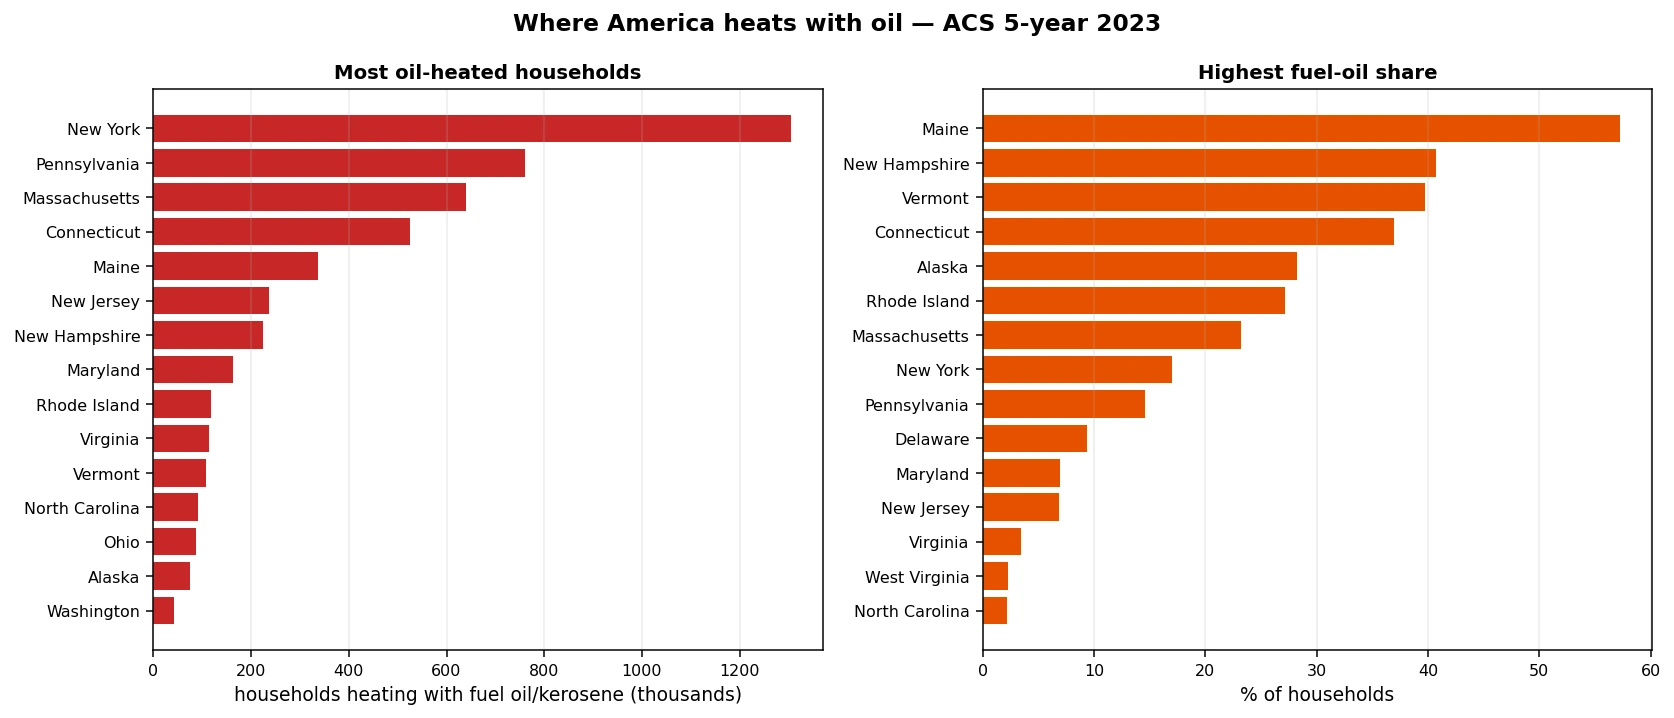
Foundation of a heating-oil demand model: households heating with fuel oil or kerosene by county (ACS 5-year). 5.2 million households — 4% of the US — overwhelmingly in the Northeast: Maine heats 57% of homes with oil.
Heating-Oil Demand Index — Oil-Weighted Degree Days
Daily heating-degree-days at every oil-heating county, weighted by that county's oil-heated household count — a single number tracking how hard America's oil furnaces are working. Current season in red against the 2018+ envelope; the cumulative panel shows how the season is running versus history.
Real-Time Demand Estimate — Thousand Barrels per Day
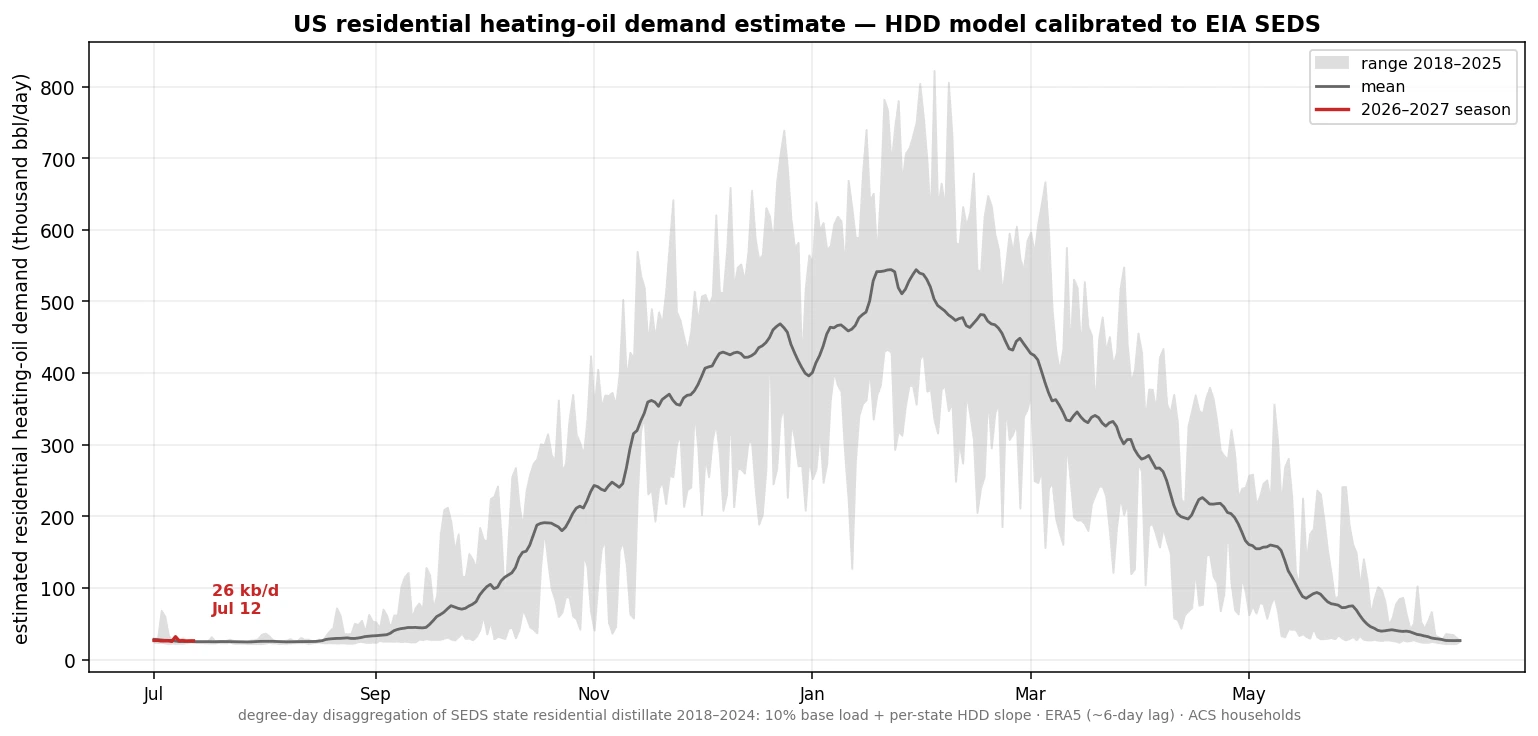
The HDD index converted to physical barrels: a degree-day disaggregation of EIA SEDS state residential distillate: 10% base load (water heaters) plus a per-state burn-per-HDD slope, so reported annual totals are reproduced exactly and the daily shape is weather. Rough by construction — it ignores prices, tank-fill timing and behavior — but it turns a cold snap into a barrels number the same day ERA5 reports it.
Twenty-Five Winters — Heating Oil Burned per Season
Measured Northeast heating-oil consumption back to the late 1990s: EIA prime-supplier sales of No. 2 fuel oil for New England and the Central Atlantic, summed over each July–June heating season. EIA discontinued the fuel-oil breakout in March 2022 (heating oil became indistinguishable from ULSD in the survey), so recent seasons are the calibrated HDD model — hatched, and scaled on the seasons where both exist (the model lands within ~7% of the survey).