HRRR vs RRFS Kinetic-Energy Power Spectra
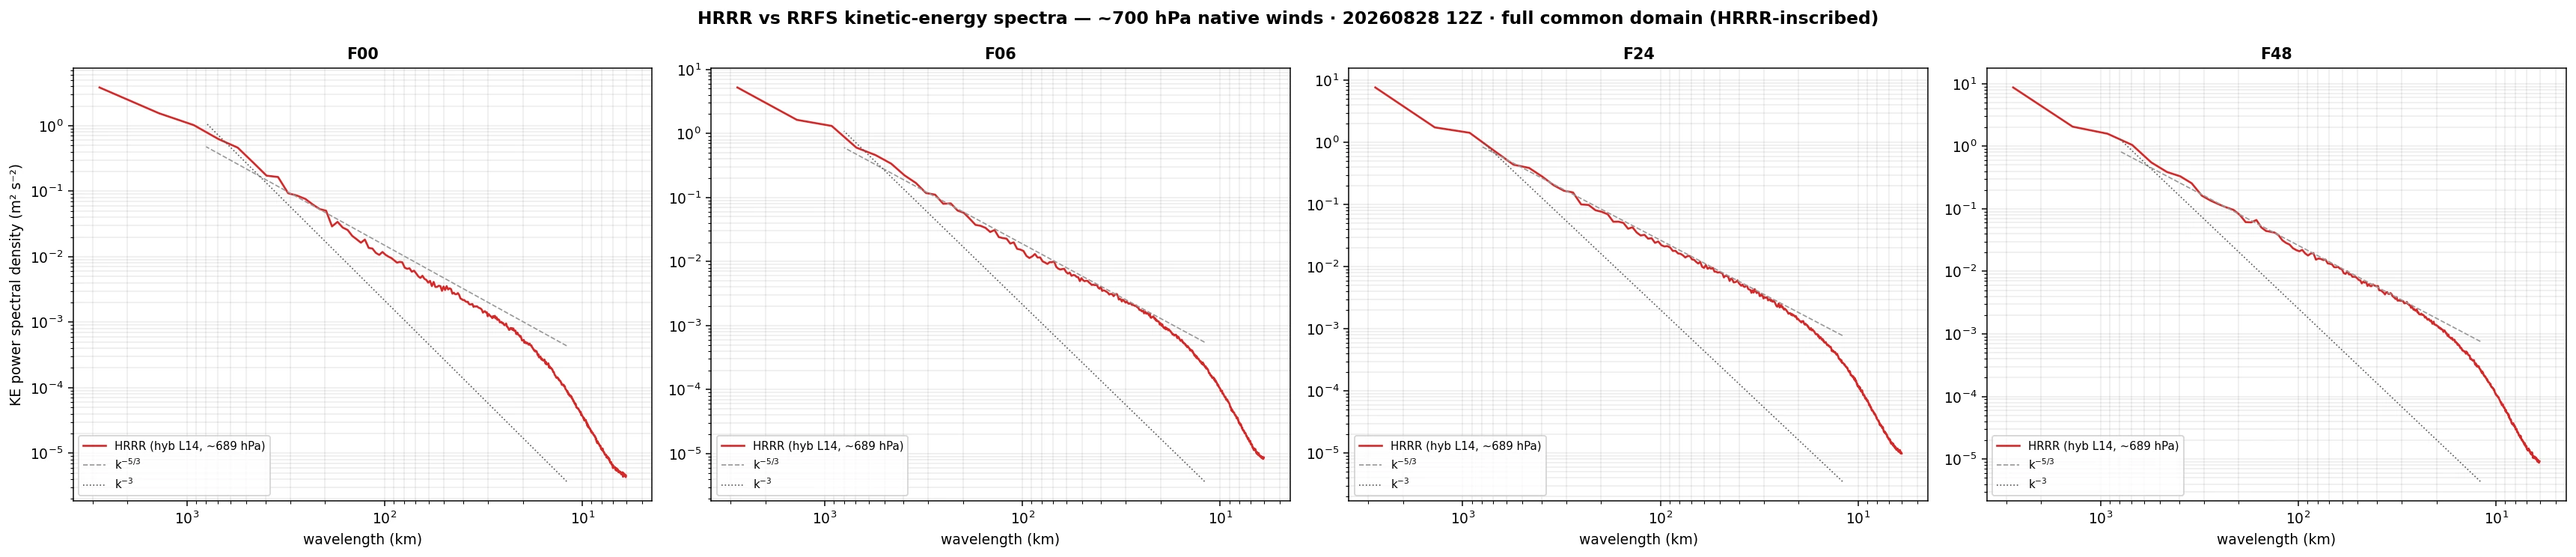
Power spectra of the kinetic energy in each model's native hybrid-level winds (~250 hPa), computed with a 2D discrete cosine transform over a common ~1,500 km central-CONUS box and binned into a 1D spectrum. Pressure-level output is smoothed by post-processing and would flatter both models — native levels show what the dynamics actually resolve. The wavelength where a spectrum peels away from the k−5/3 mesoscale slope is that model's effective resolution; comparing F00 with later leads shows how quickly small scales spin up from the analysis.
Reading the figure
Both models follow the k−3 synoptic slope at long wavelengths and transition to the shallower k−5/3 mesoscale range near a few hundred kilometres — the classic kink seen in aircraft observations. The steep roll-off at the short-wave end is each model's dissipation range; variance is effectively gone by ~6–8Δx, which is why "3 km" models resolve ~30 km features.
At F00 the RRFS analysis retains more small-scale variance than the HRRR's; by F06 the HRRR has spun up its mesoscale and the two swap. Differences between the models' curves at later leads are genuine differences in how much fine-scale energy the dynamics and physics sustain.