El Niño Analog Comparisons
The current event measured against the 1997–98, 2015–16 and 2023–24 El Niños at matching phase in surface, subsurface, and low-level wind. Where possible the warming background is removed so events decades apart are comparable.
Interactive Explorer: Niño Metrics vs. Past El Niños (since 1970)
Overlay the current event against any El Niño since 1970 for any Niño region (or the ONI). Events are aligned by month relative to their DJF peak (so the shapes and amplitudes compare directly), or switch to an ENSO-calendar view (development year → the following year). The current event (bold black) is aligned to its climatological December peak, so its lead-up sits against where each analog stood before its peak.
This Event vs. 1997, 2015 & 2023
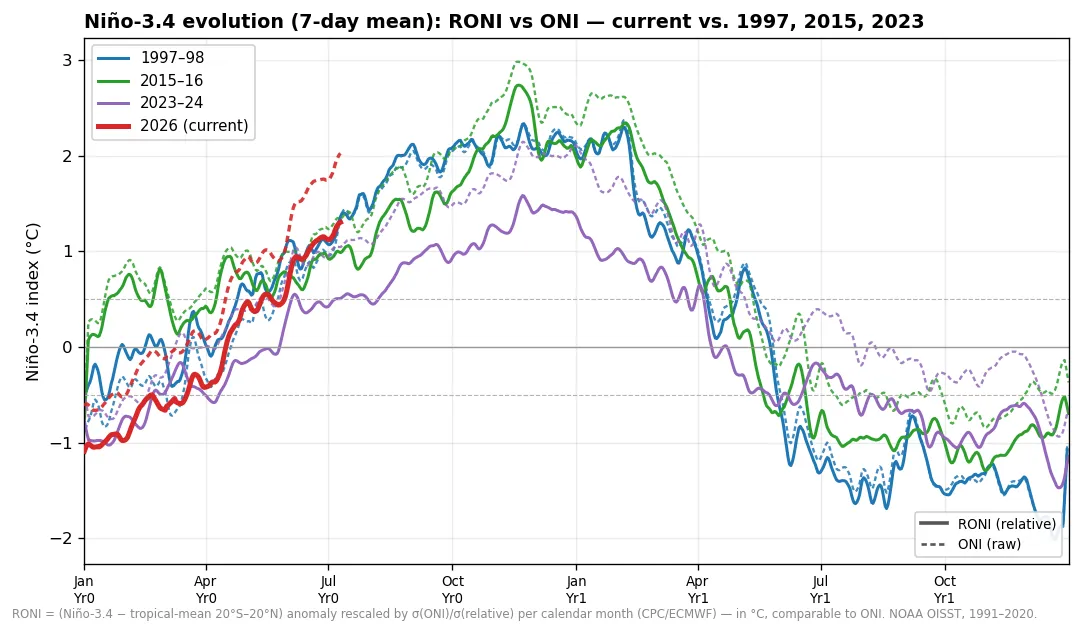
Niño-3.4 evolution (7-day running mean) through each event's development year and the next. Bold lines are RONI, the relative index (Niño-3.4 minus the 20°S–20°N tropical-mean anomaly), which removes the rising warming background so events decades apart are comparable; faint dotted lines are the raw ONI for reference. The current event is red. Note how 2015's record ONI shrinks toward 1997 once the background is removed.
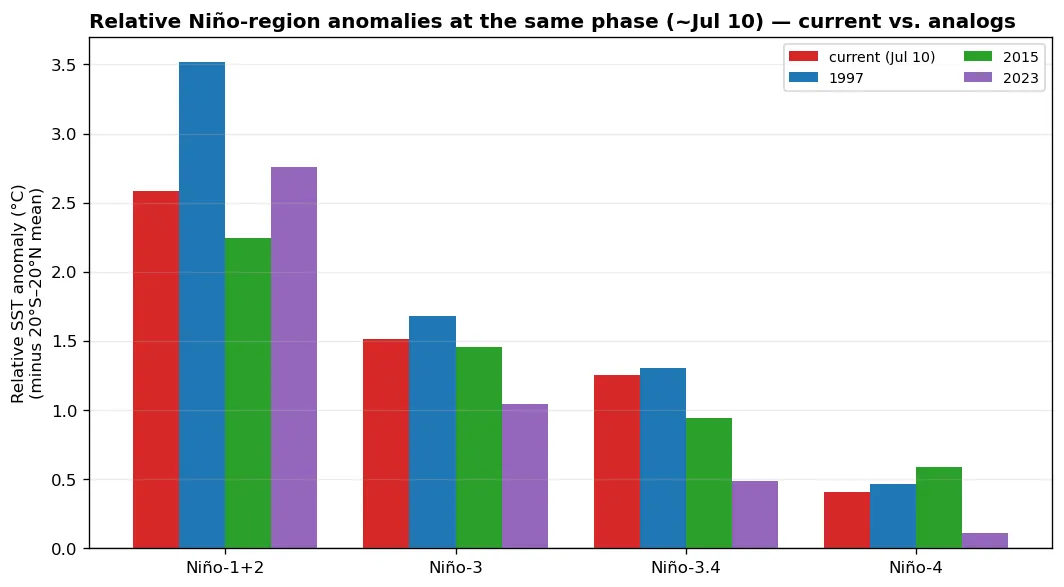
El Niño Flavor: Niño Regions vs. Analogs
Relative Niño-1+2 / 3 / 3.4 / 4 anomalies (7-day mean, each minus the 20°S–20°N tropical mean) at the same calendar day as the latest data, for the current event and the three analogs. Removing the tropical background makes the regions comparable across events; strong eastern (1+2, 3) relative to central (4) marks an East-Pacific-flavored event.
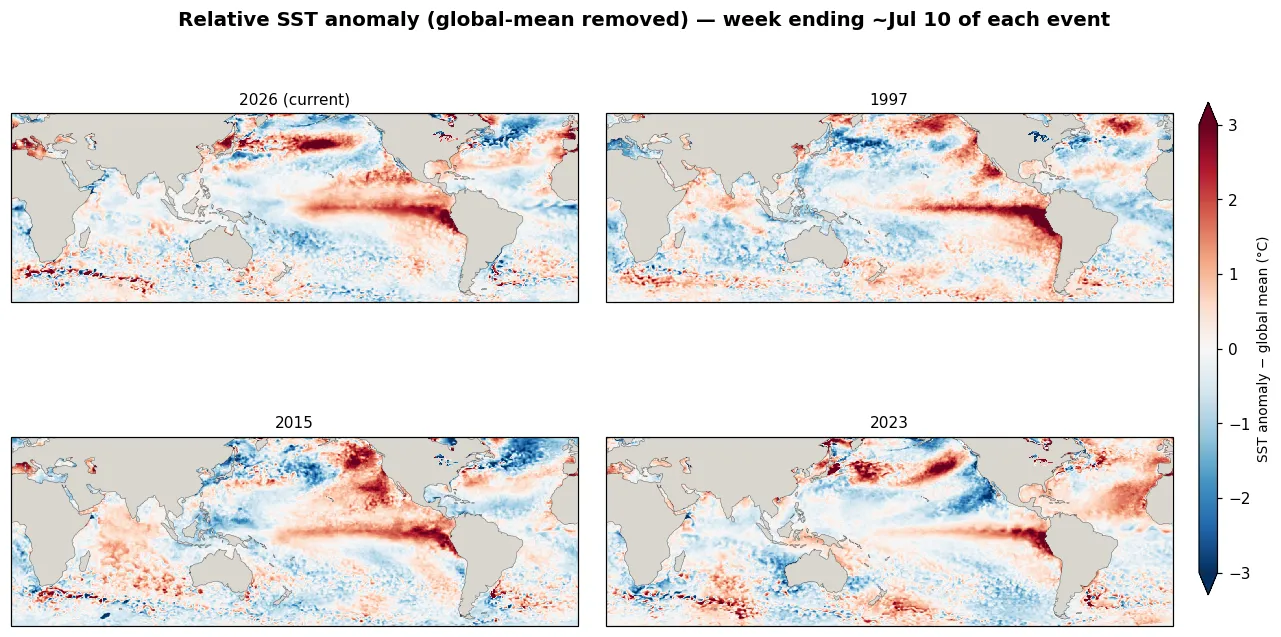
Matching-Phase SST Anomaly Maps
Relative SST anomaly (the area-weighted global-mean anomaly removed from each map) for the latest available week vs. the same calendar week in 1997, 2015 and 2023. Stripping the global mean removes the secular warming trend, so the ENSO spatial pattern is comparable across events that sat on very different baselines.
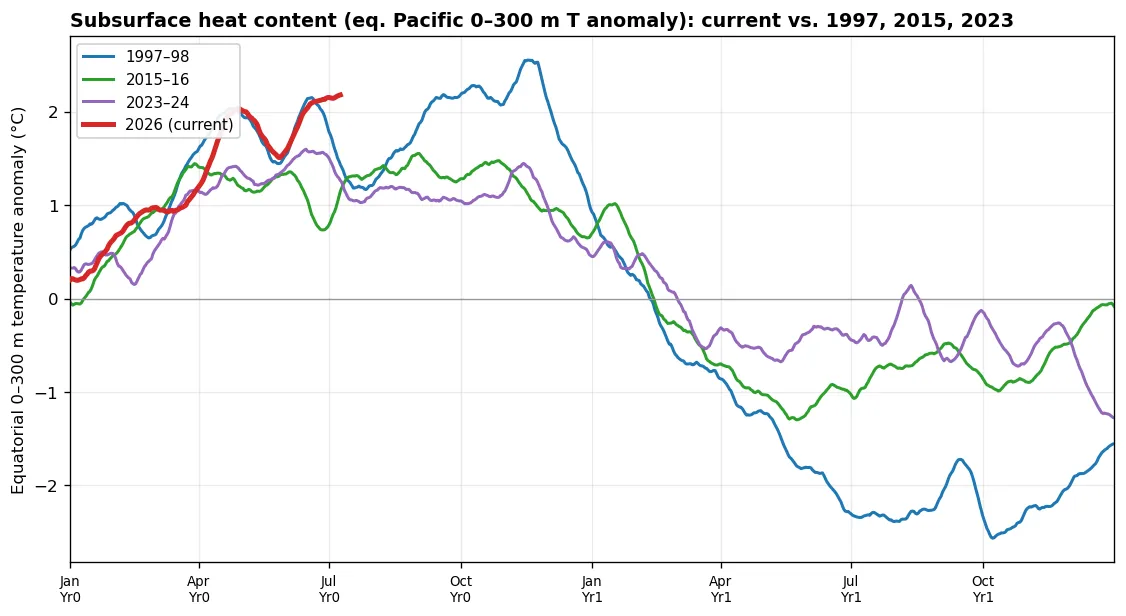
Subsurface Heat Content vs. Analogs
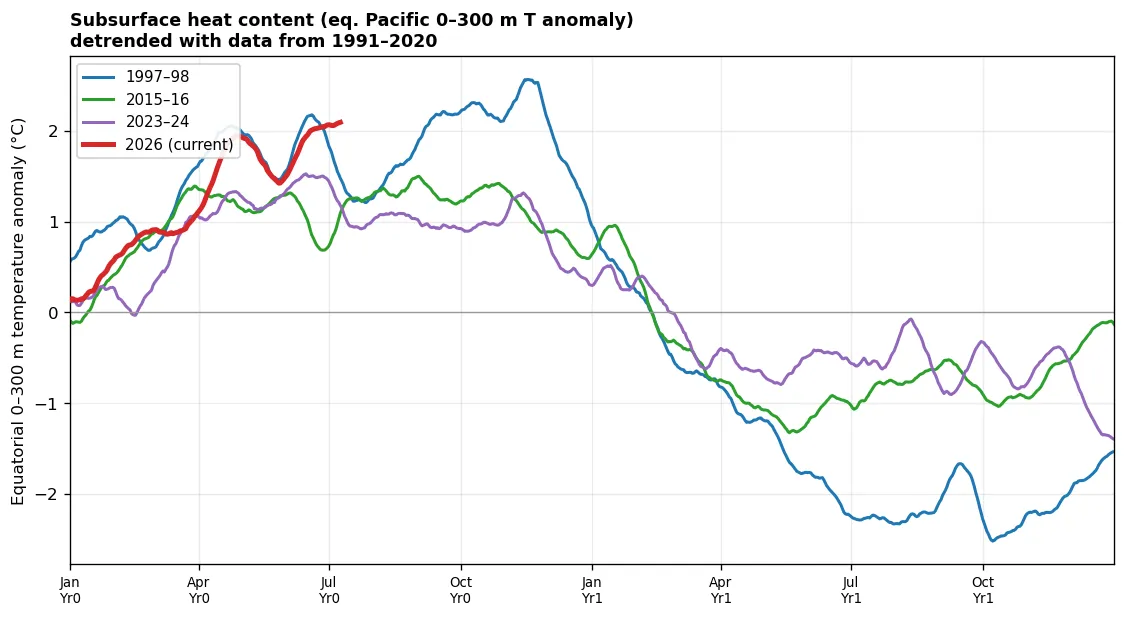
Equatorial Pacific upper-ocean (0–300 m) temperature anomaly (a heat-content proxy that leads the surface) through each event's development year and the next, current (bold red) overlaid on 1997, 2015 and 2023. The subsurface warm reservoir is the fuel for El Niño; watch whether the current build-up keeps pace with the analogs.
Subsurface Heat Content vs. Analogs: De-trended
The same heat-content comparison with the 1991–2020 climate trend removed, so the four events sit on a common baseline. The net 0–300 m effect is modest (the subsurface warming and cooling trends largely cancel in the column average), but it eases the recent events (2023, current) down relative to 1997.
Subsurface Cross-Section vs. Analogs
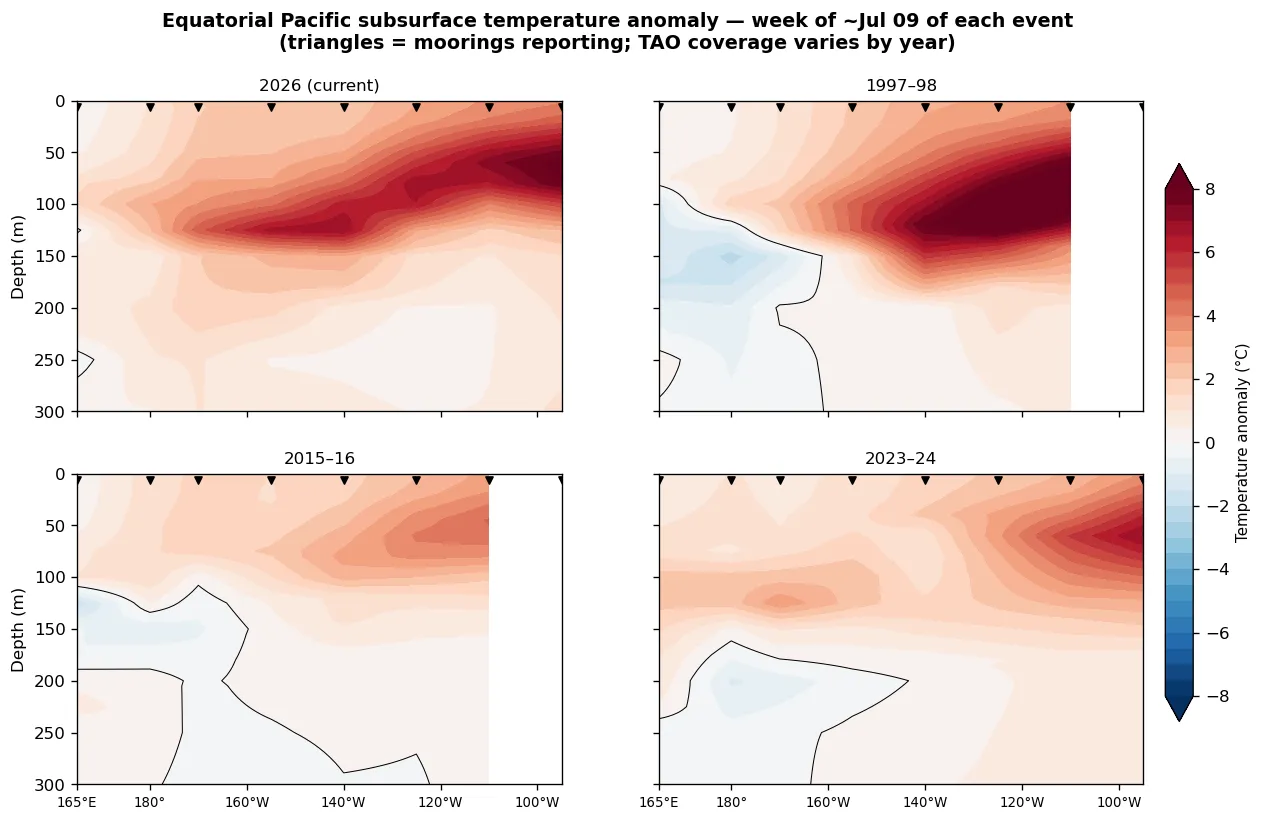
Equatorial depth×longitude temperature anomaly at the same phase (~the latest data week) of each event. The eastward-deepening warm anomaly along the thermocline is the classic El Niño subsurface signature; comparing its depth and intensity against 1997/2015/2023 gauges how loaded the ocean is now.
Note: TAO mooring coverage varies by year (triangles mark moorings reporting), so 1997 and 2023 have missing longitudes.
Subsurface Cross-Section vs. Analogs: De-trended
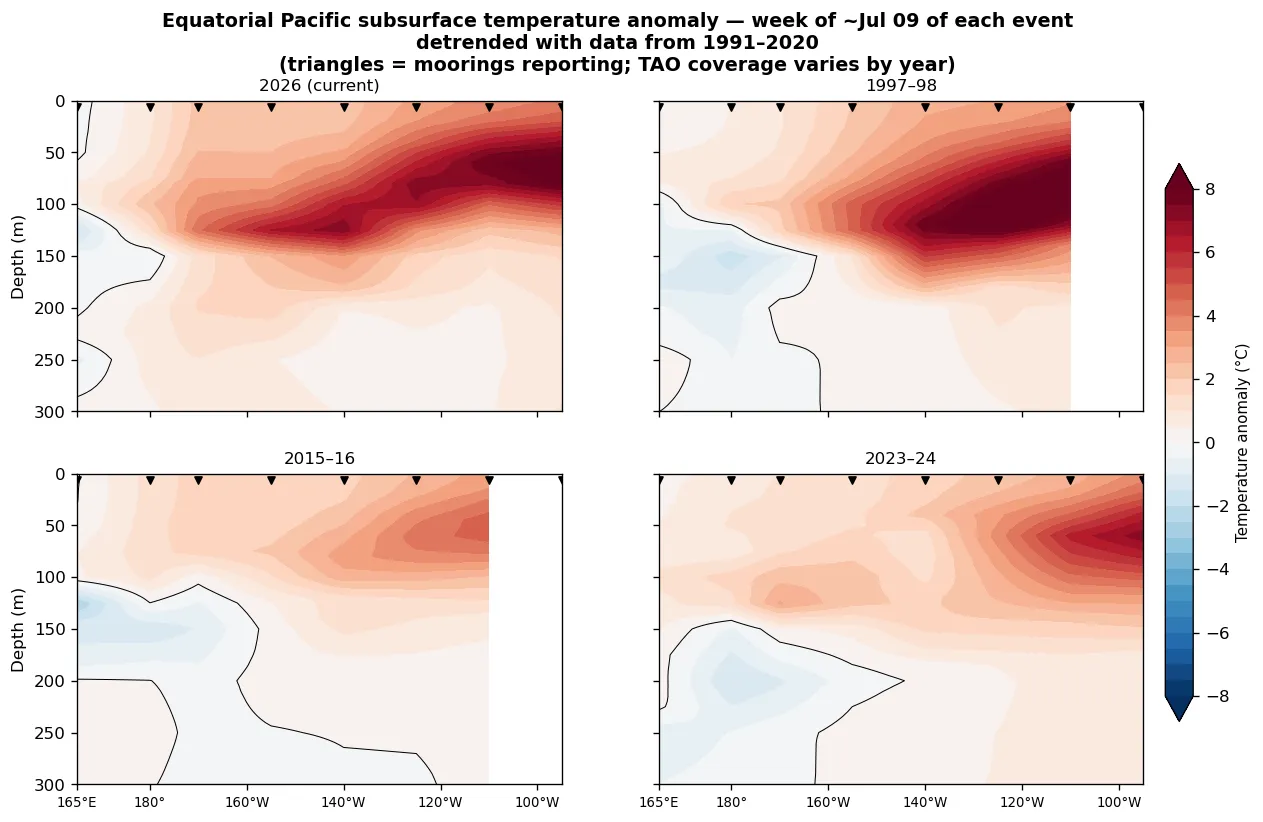
The matching-phase cross-sections with the 1991–2020 climate trend removed. Because the trend has real depth×longitude structure (west-Pacific subsurface warming, eastern-thermocline cooling), de-trending reshapes the pattern more here than in the column-mean heat content above.
Note: TAO mooring coverage varies by year (triangles mark moorings reporting), so 1997 and 2023 have missing longitudes.
Low-Level Wind vs. Analogs: 850 hPa Hovmöller
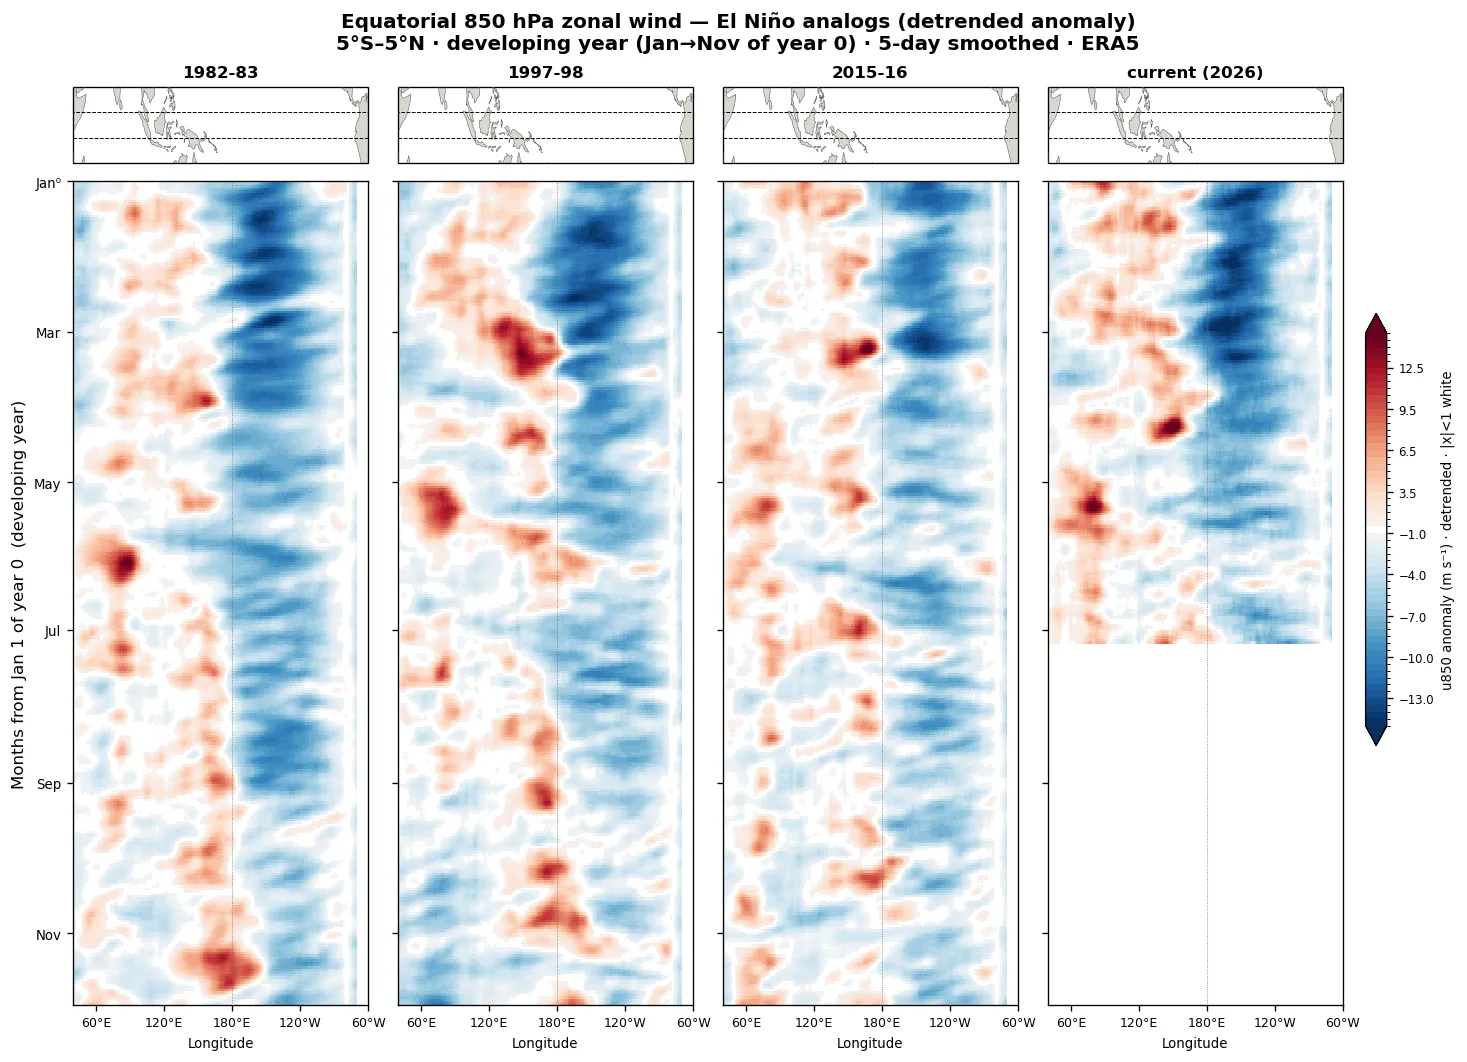
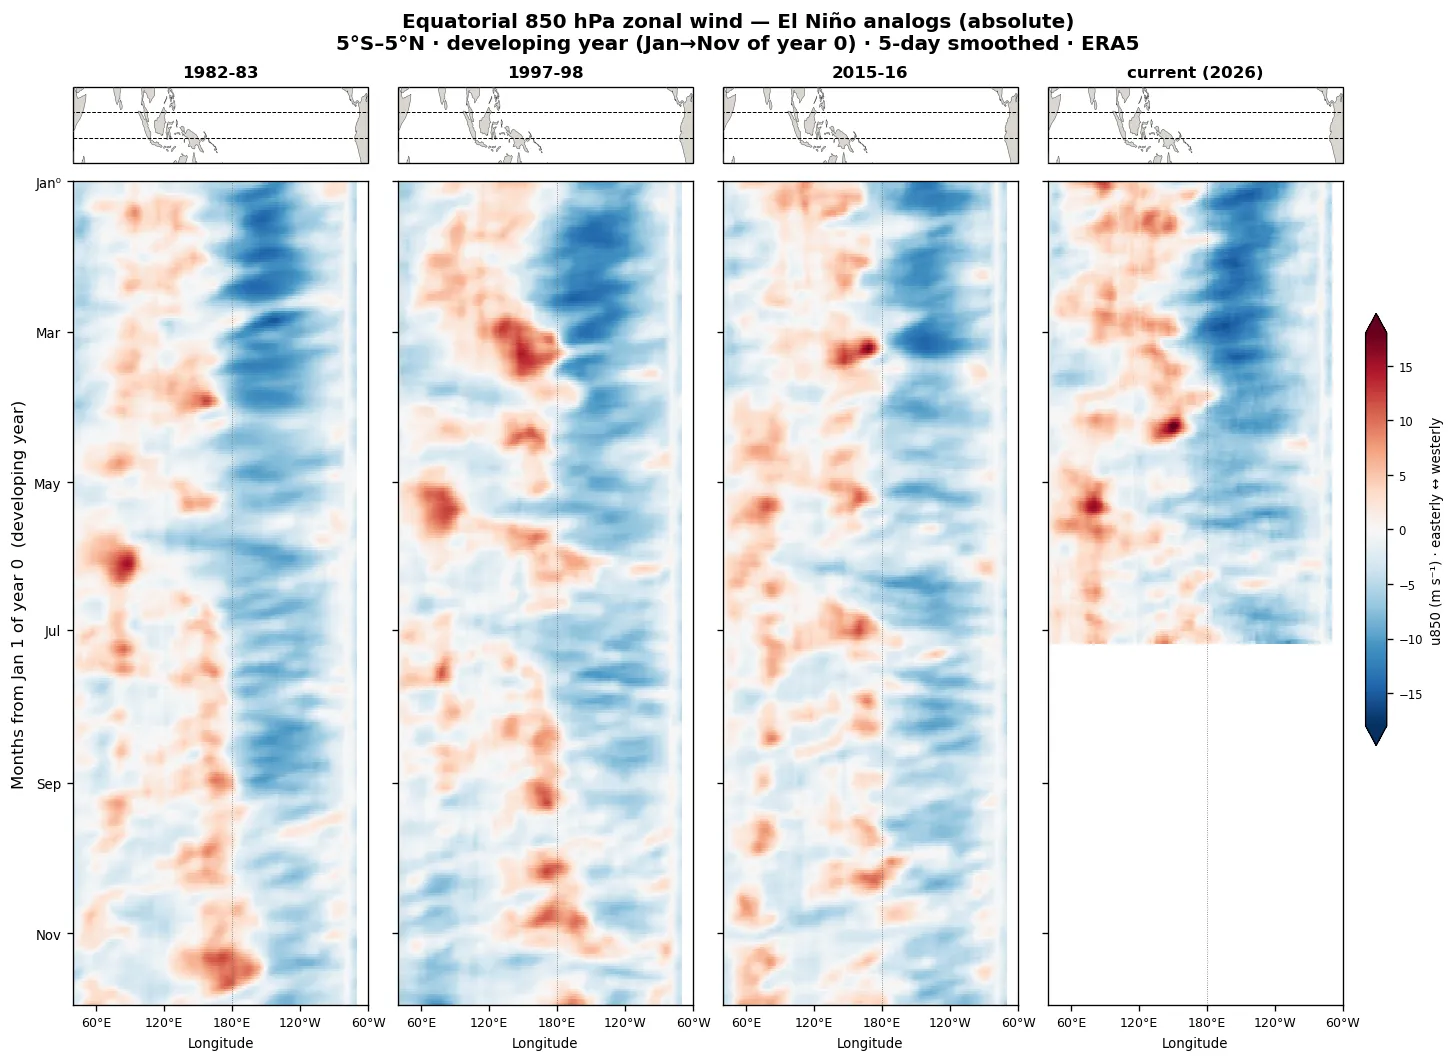
Equatorial (5°S–5°N) 850 hPa zonal wind through the developing year (Jan→Nov of year 0) of each El Niño, aligned by calendar so the current event sits beside its analogs at the same phase. Westerly anomalies (red) over the Indian Ocean–west Pacific push warm water east and sustain a developing event; the historical analogs show those westerlies expanding eastward through the year. Left: detrended anomaly (long-term trend removed). Right: absolute wind (easterly trades vs. westerly bursts). 5-day smoothed.
U.S. City Temperatures vs. Analogs
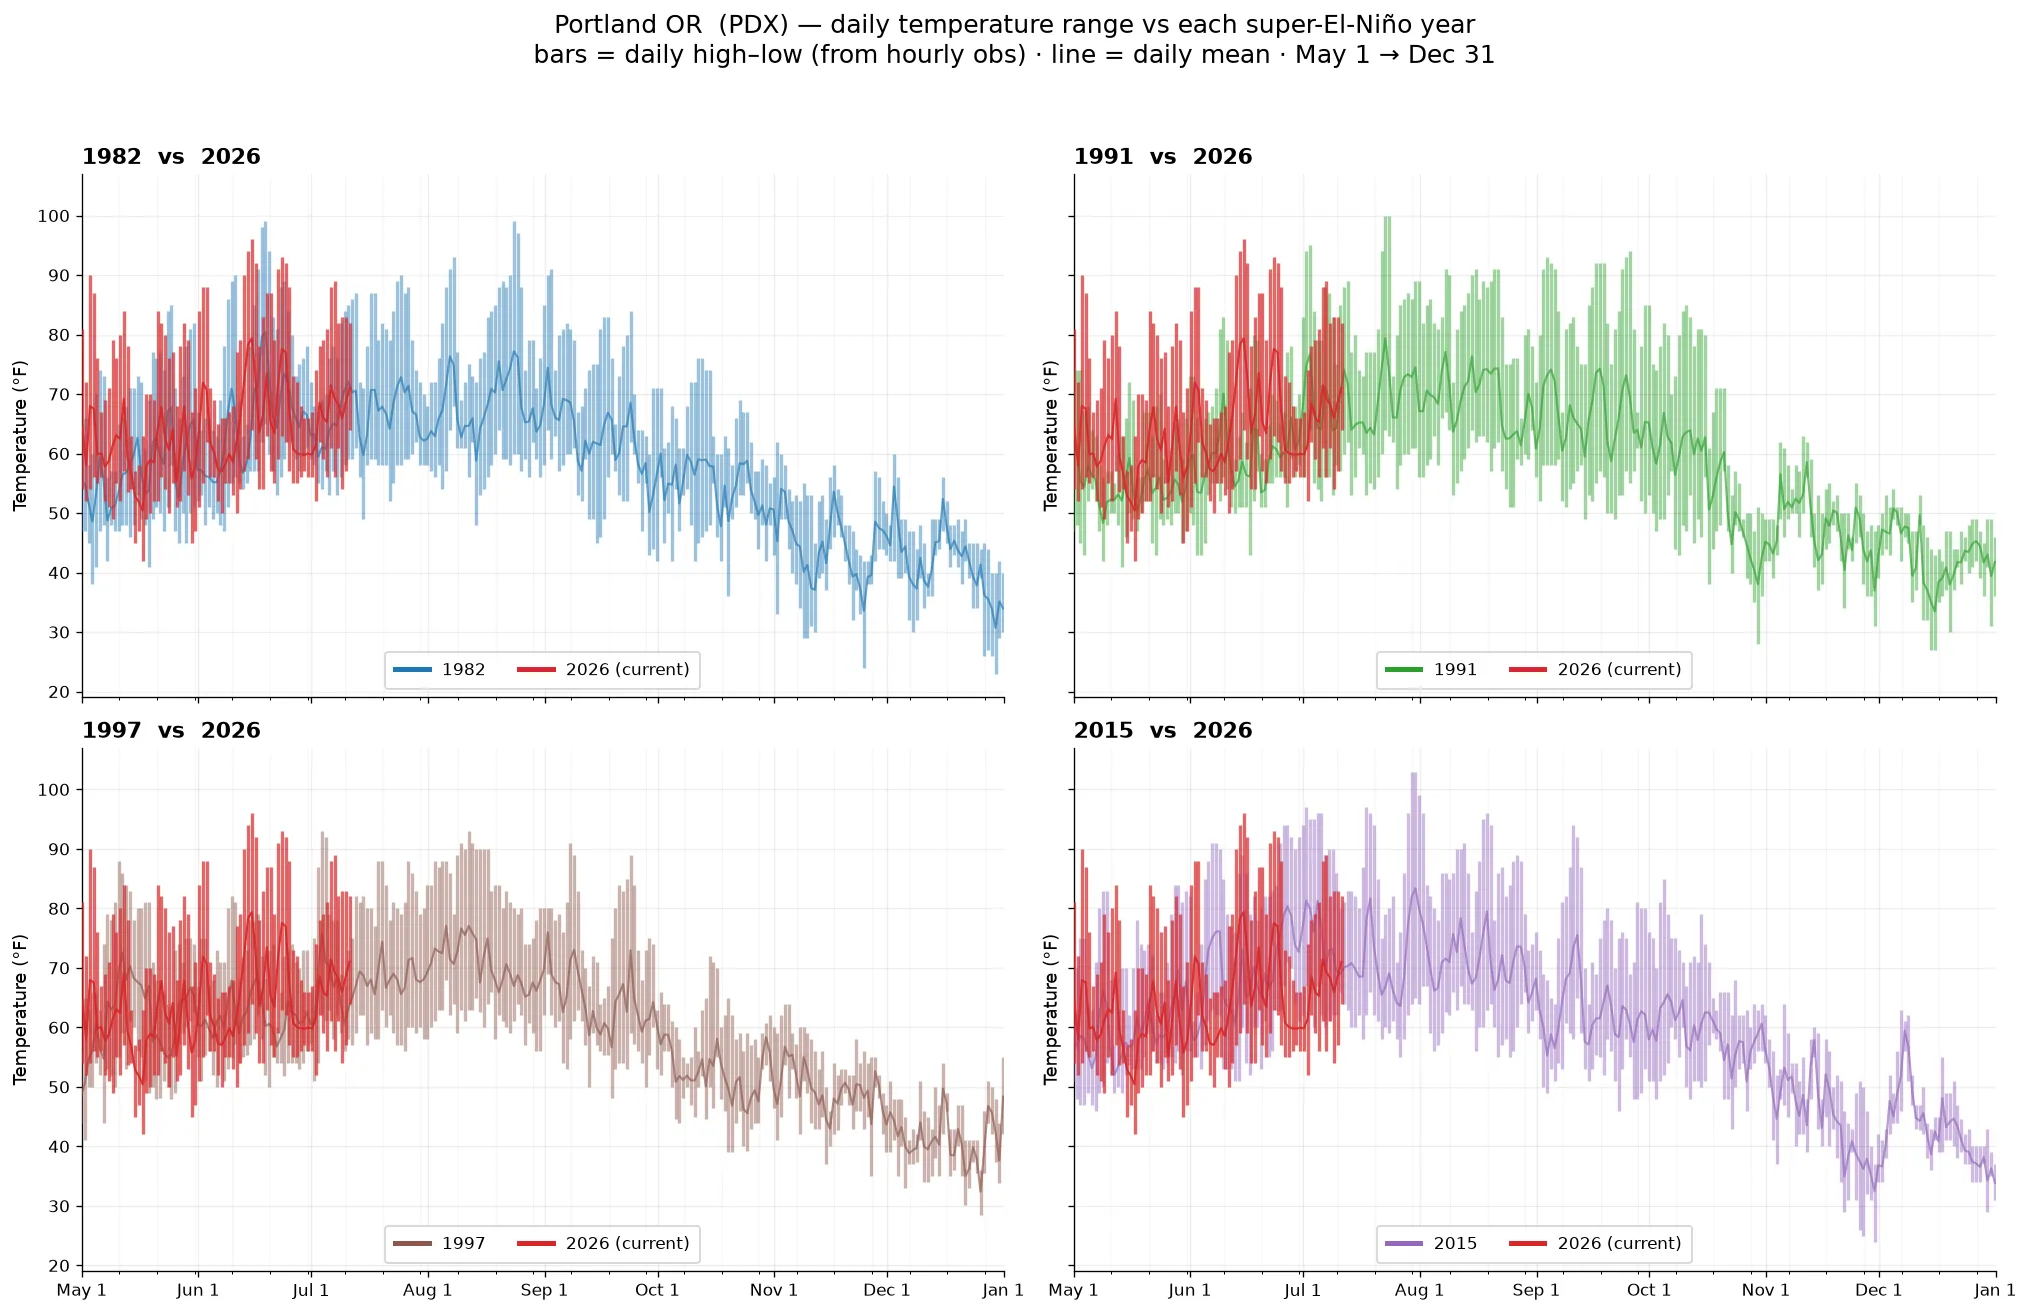
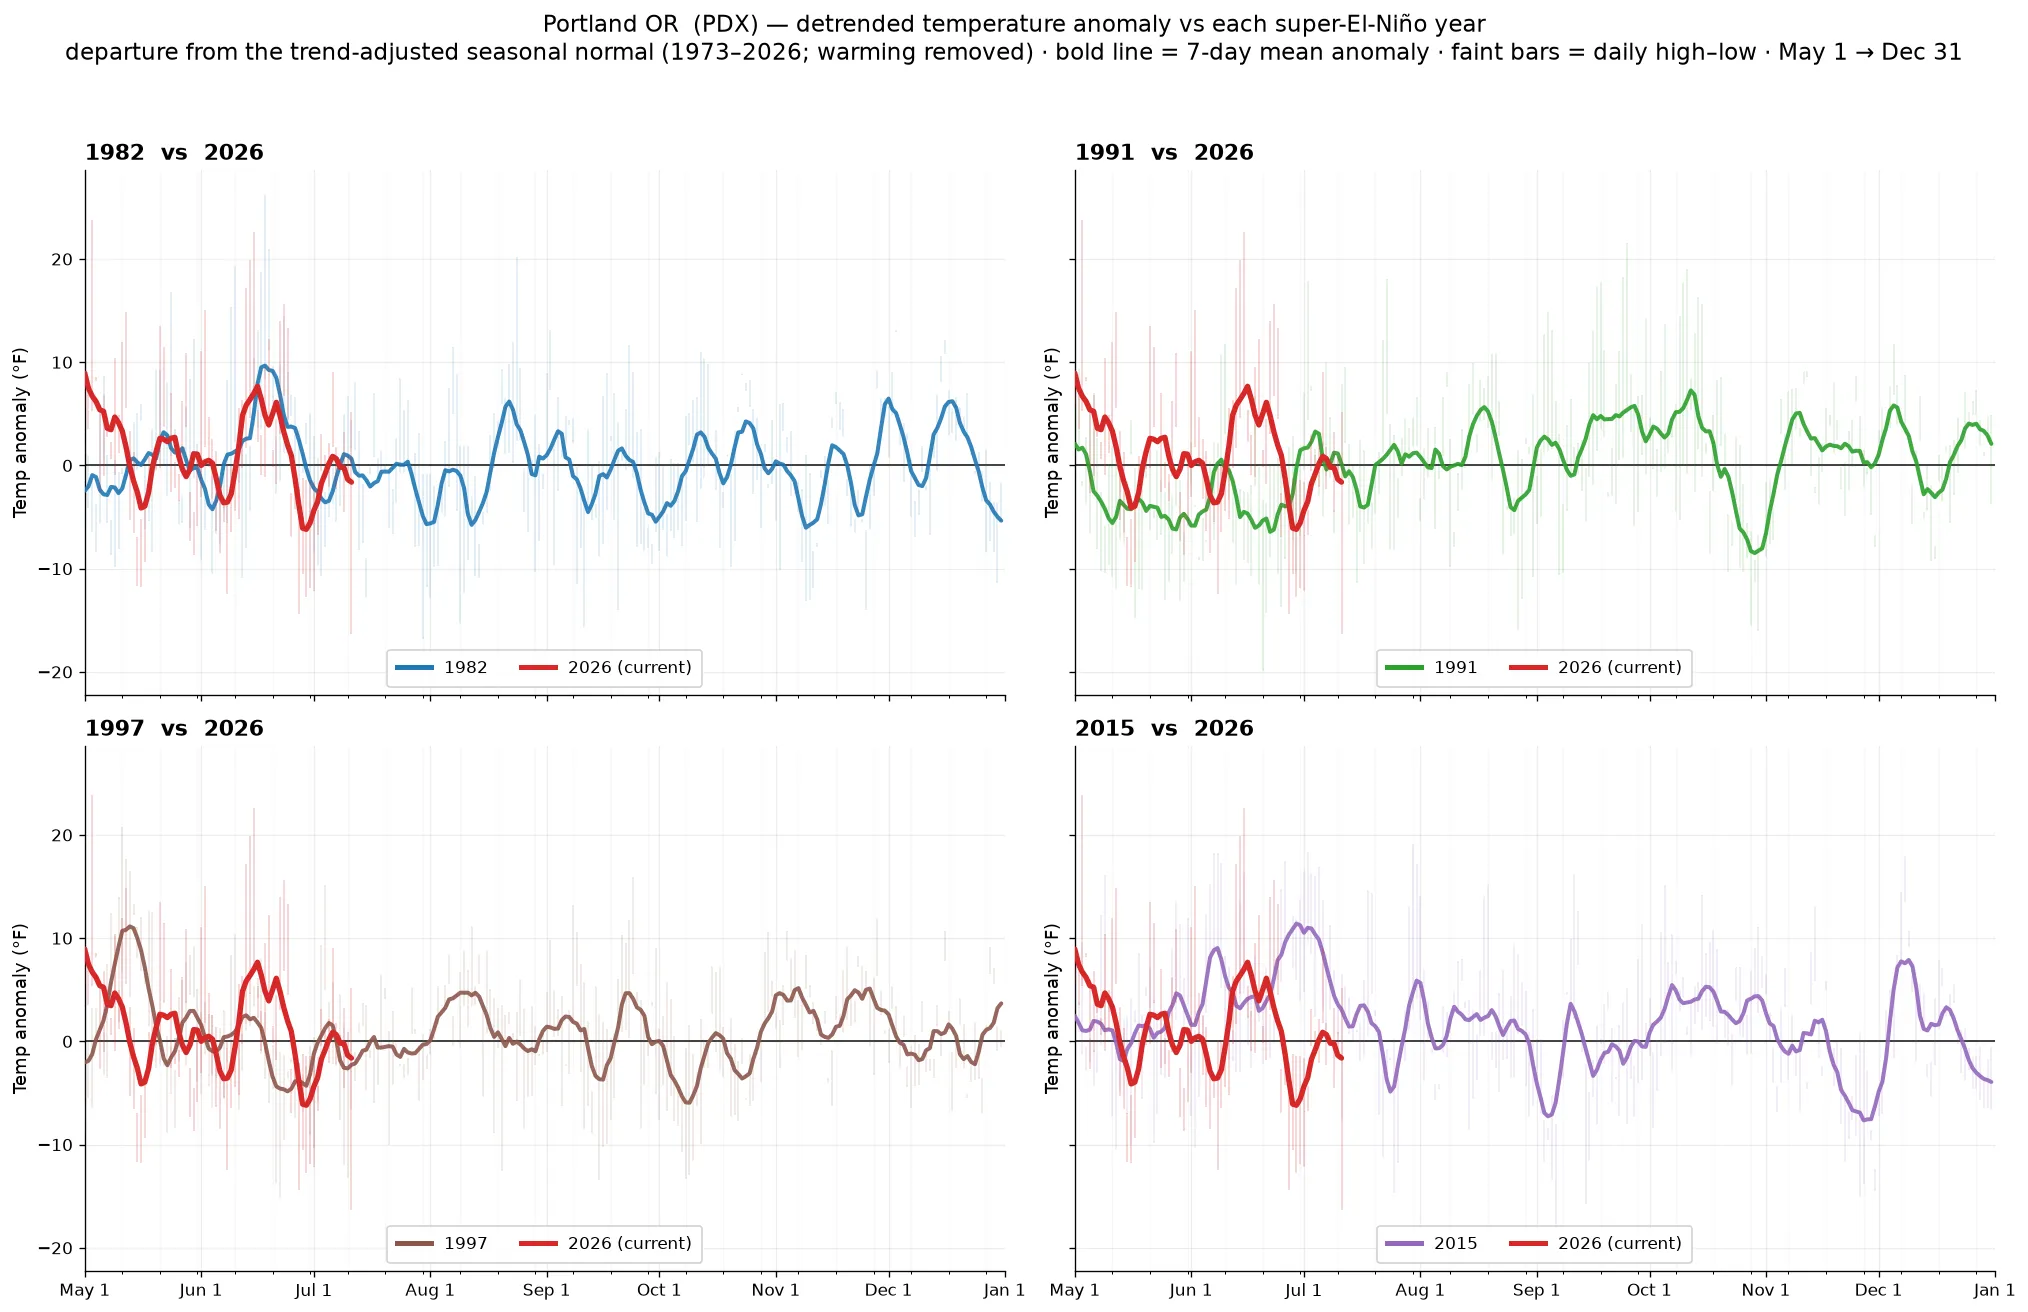
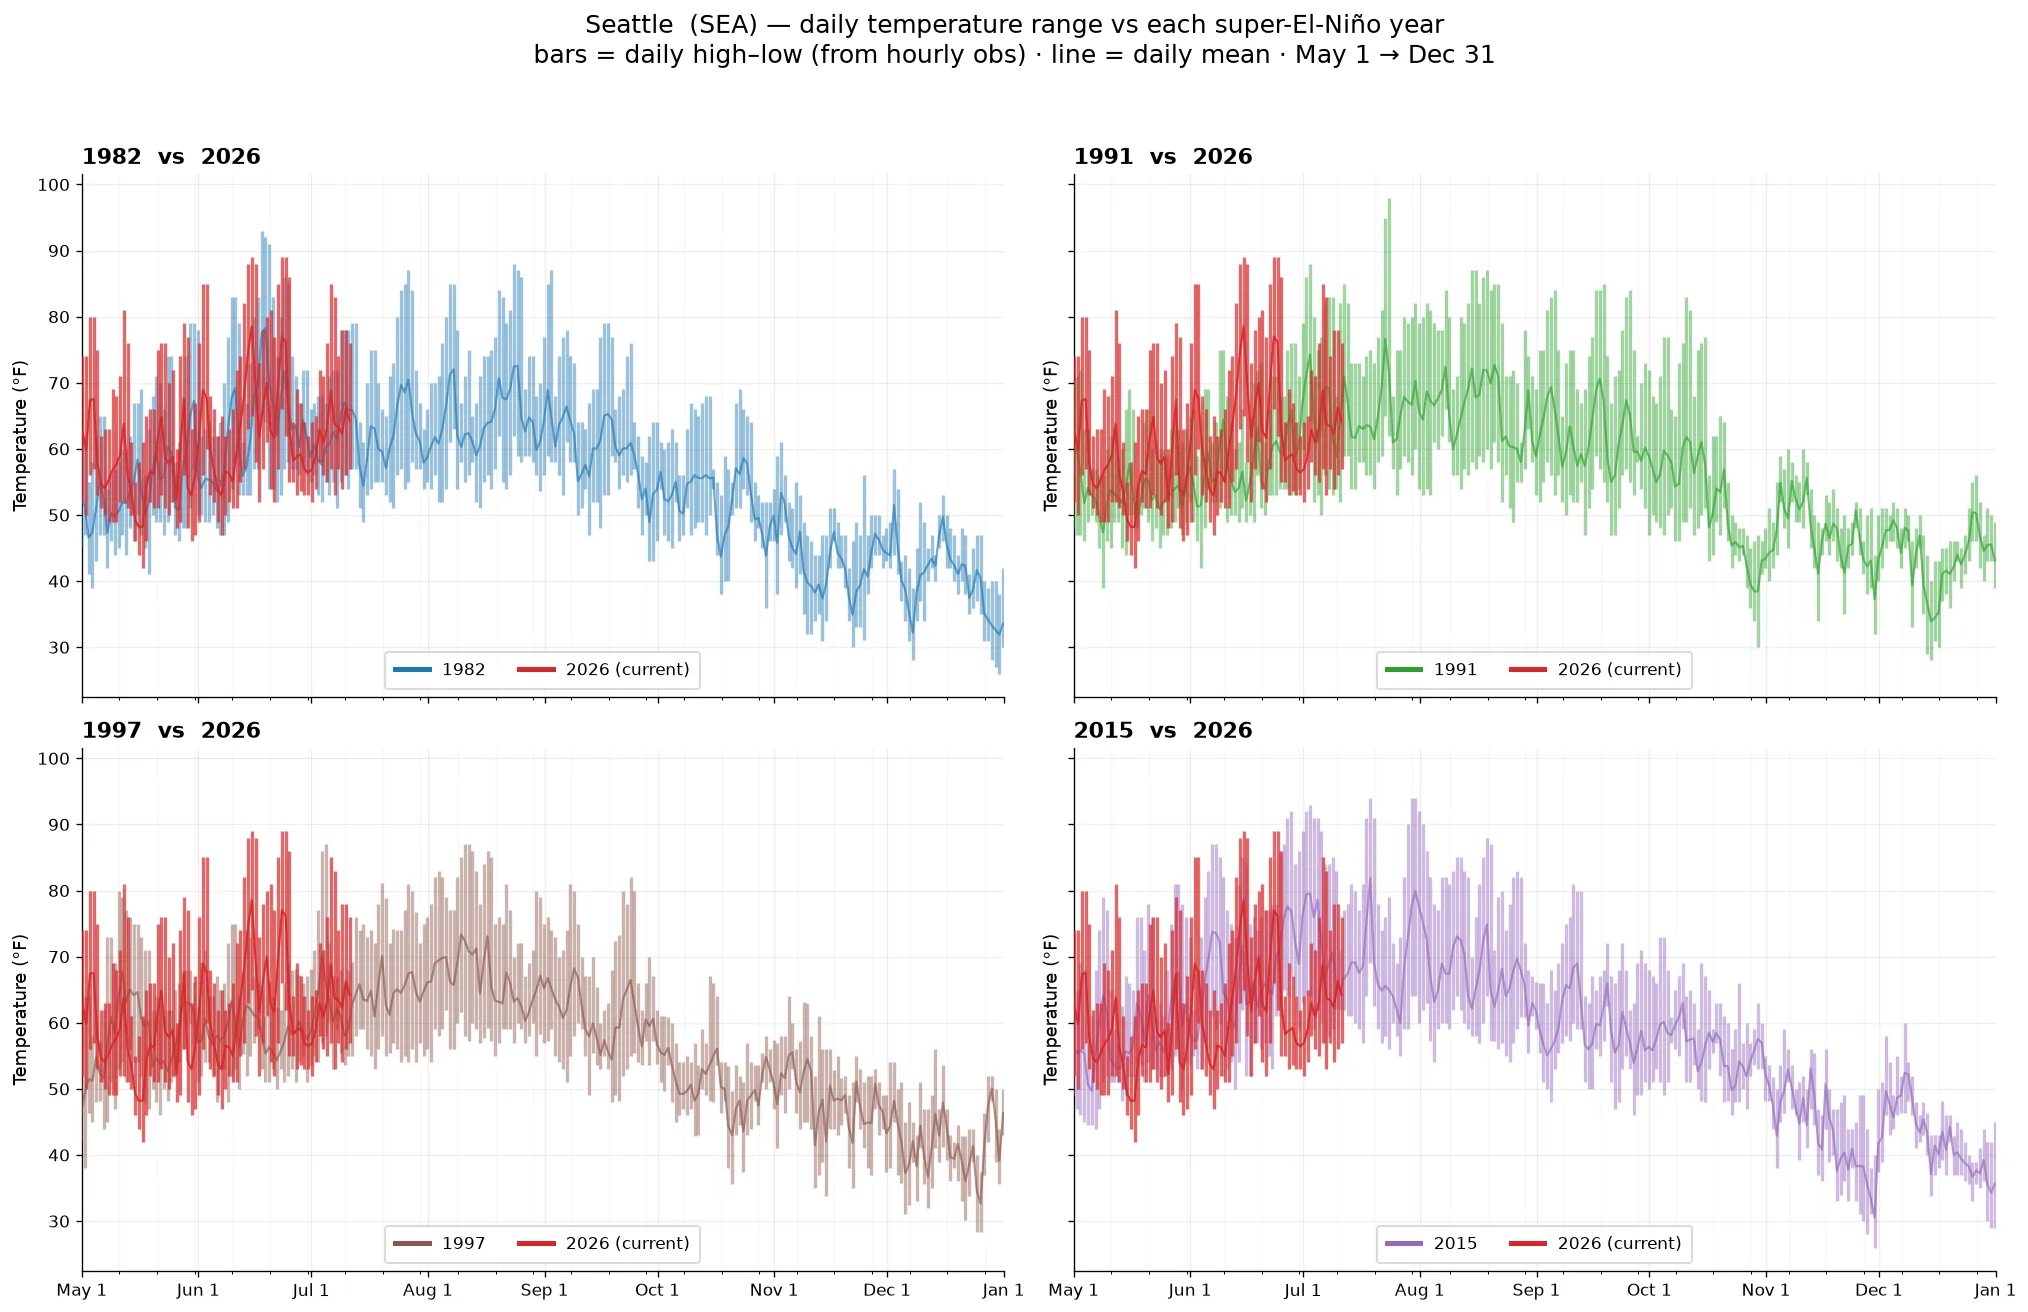
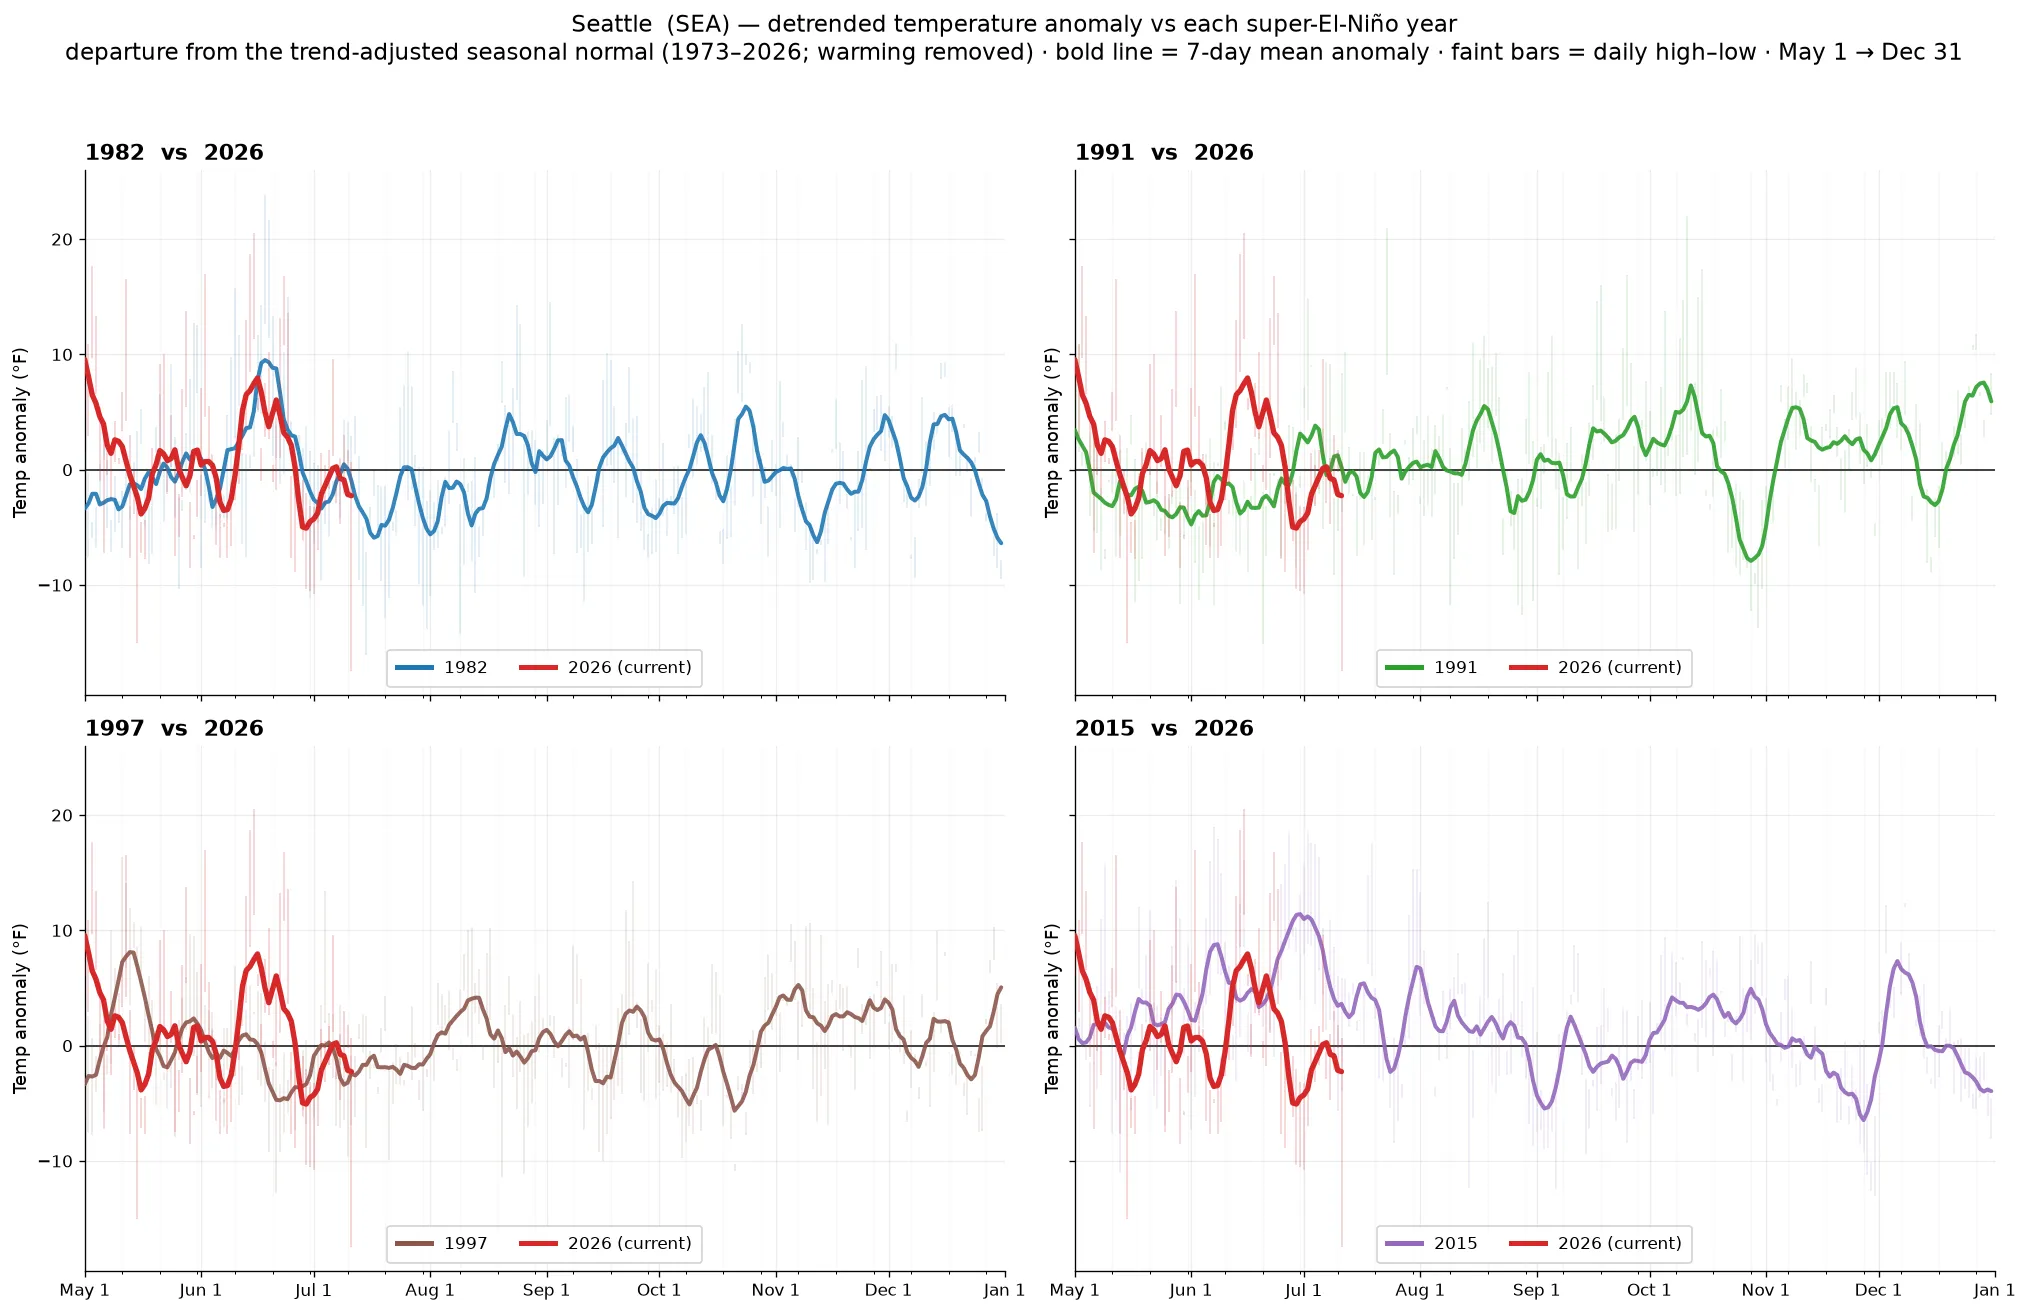
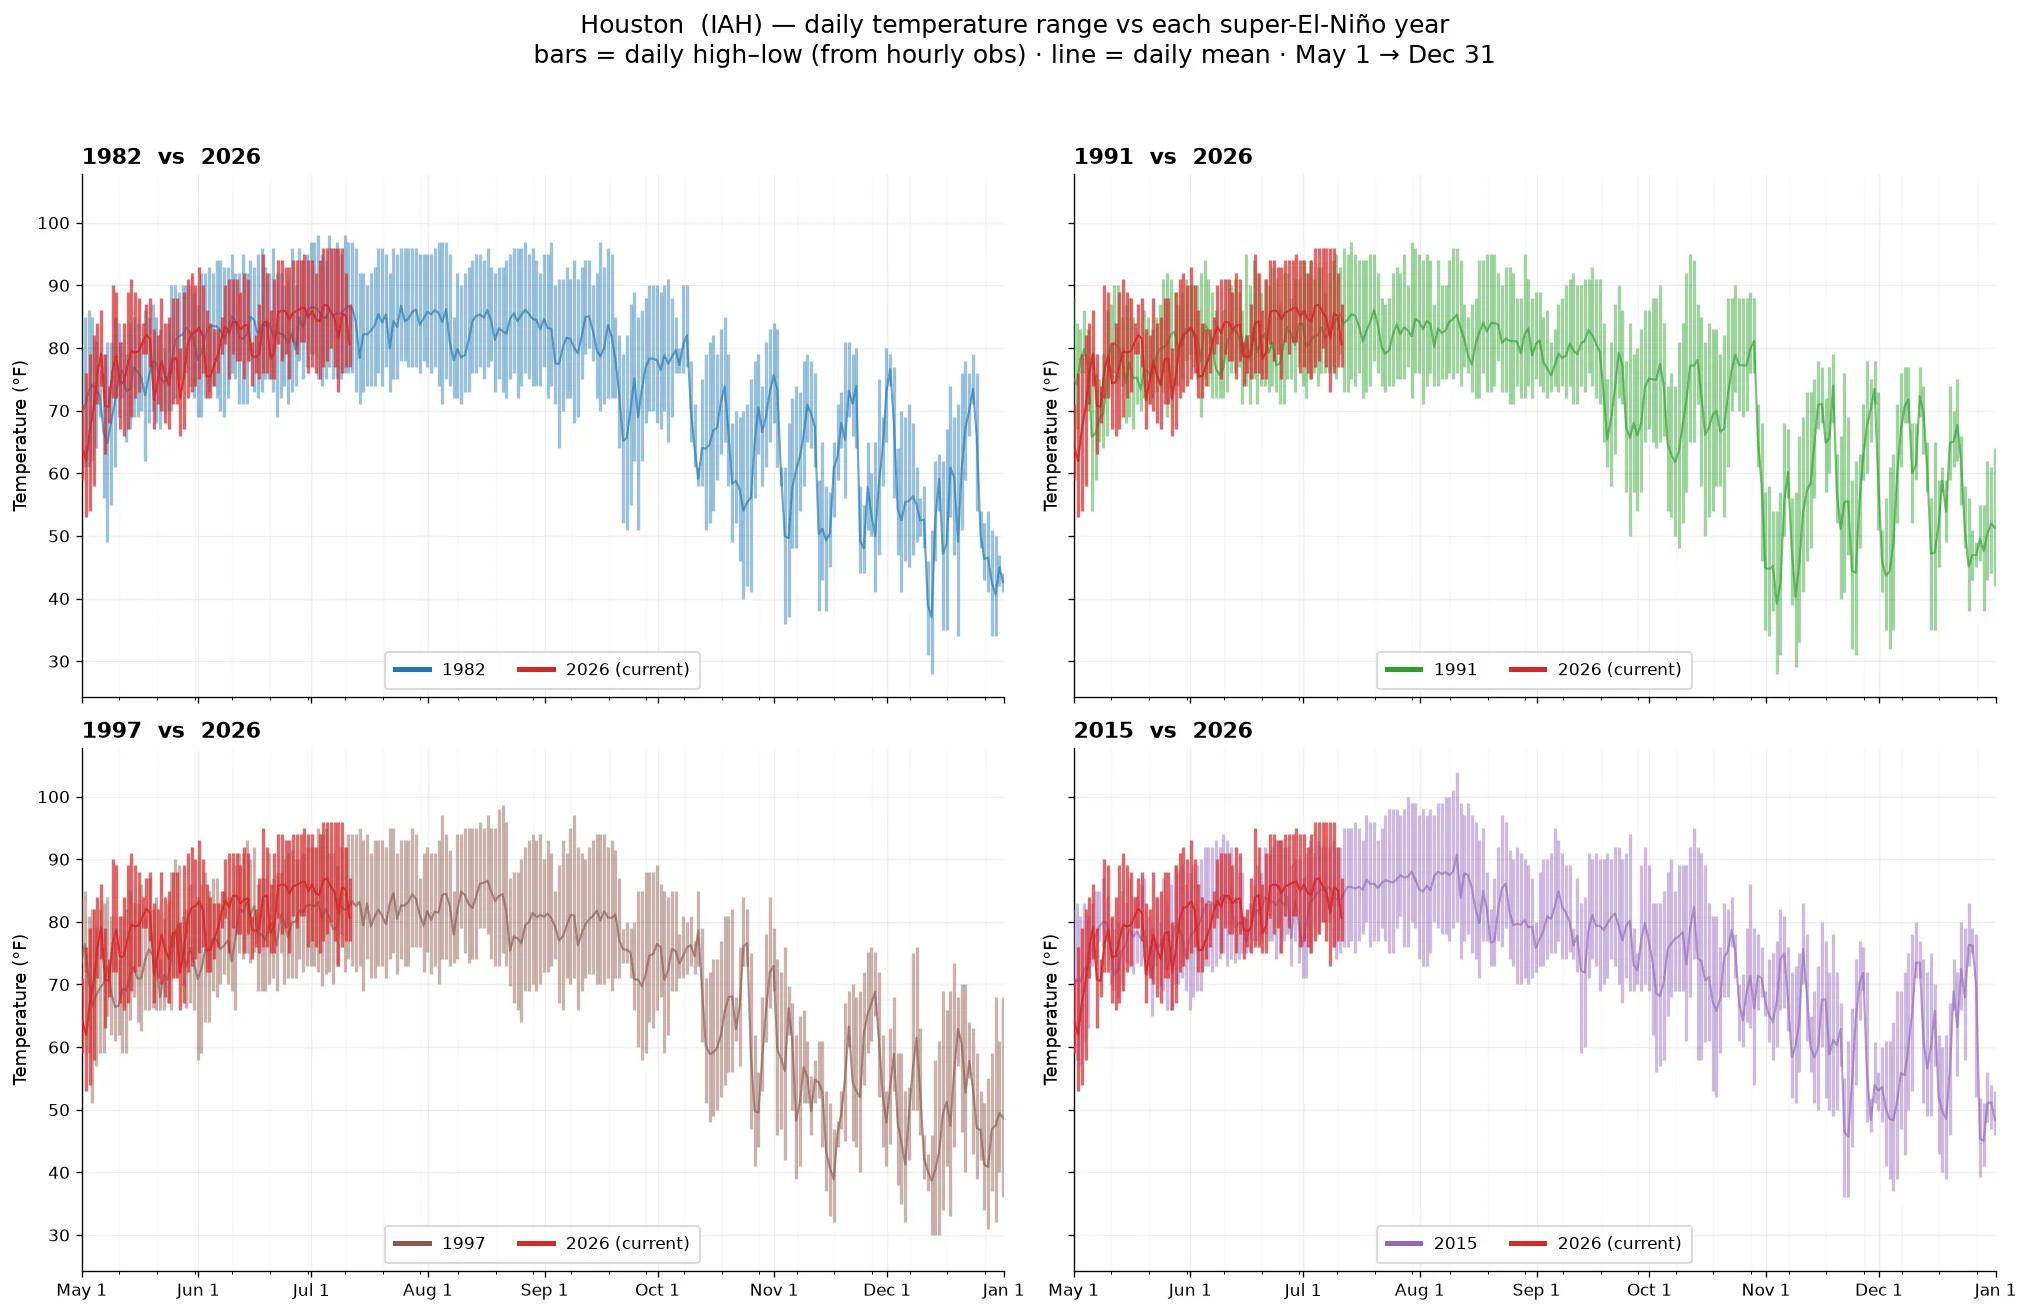
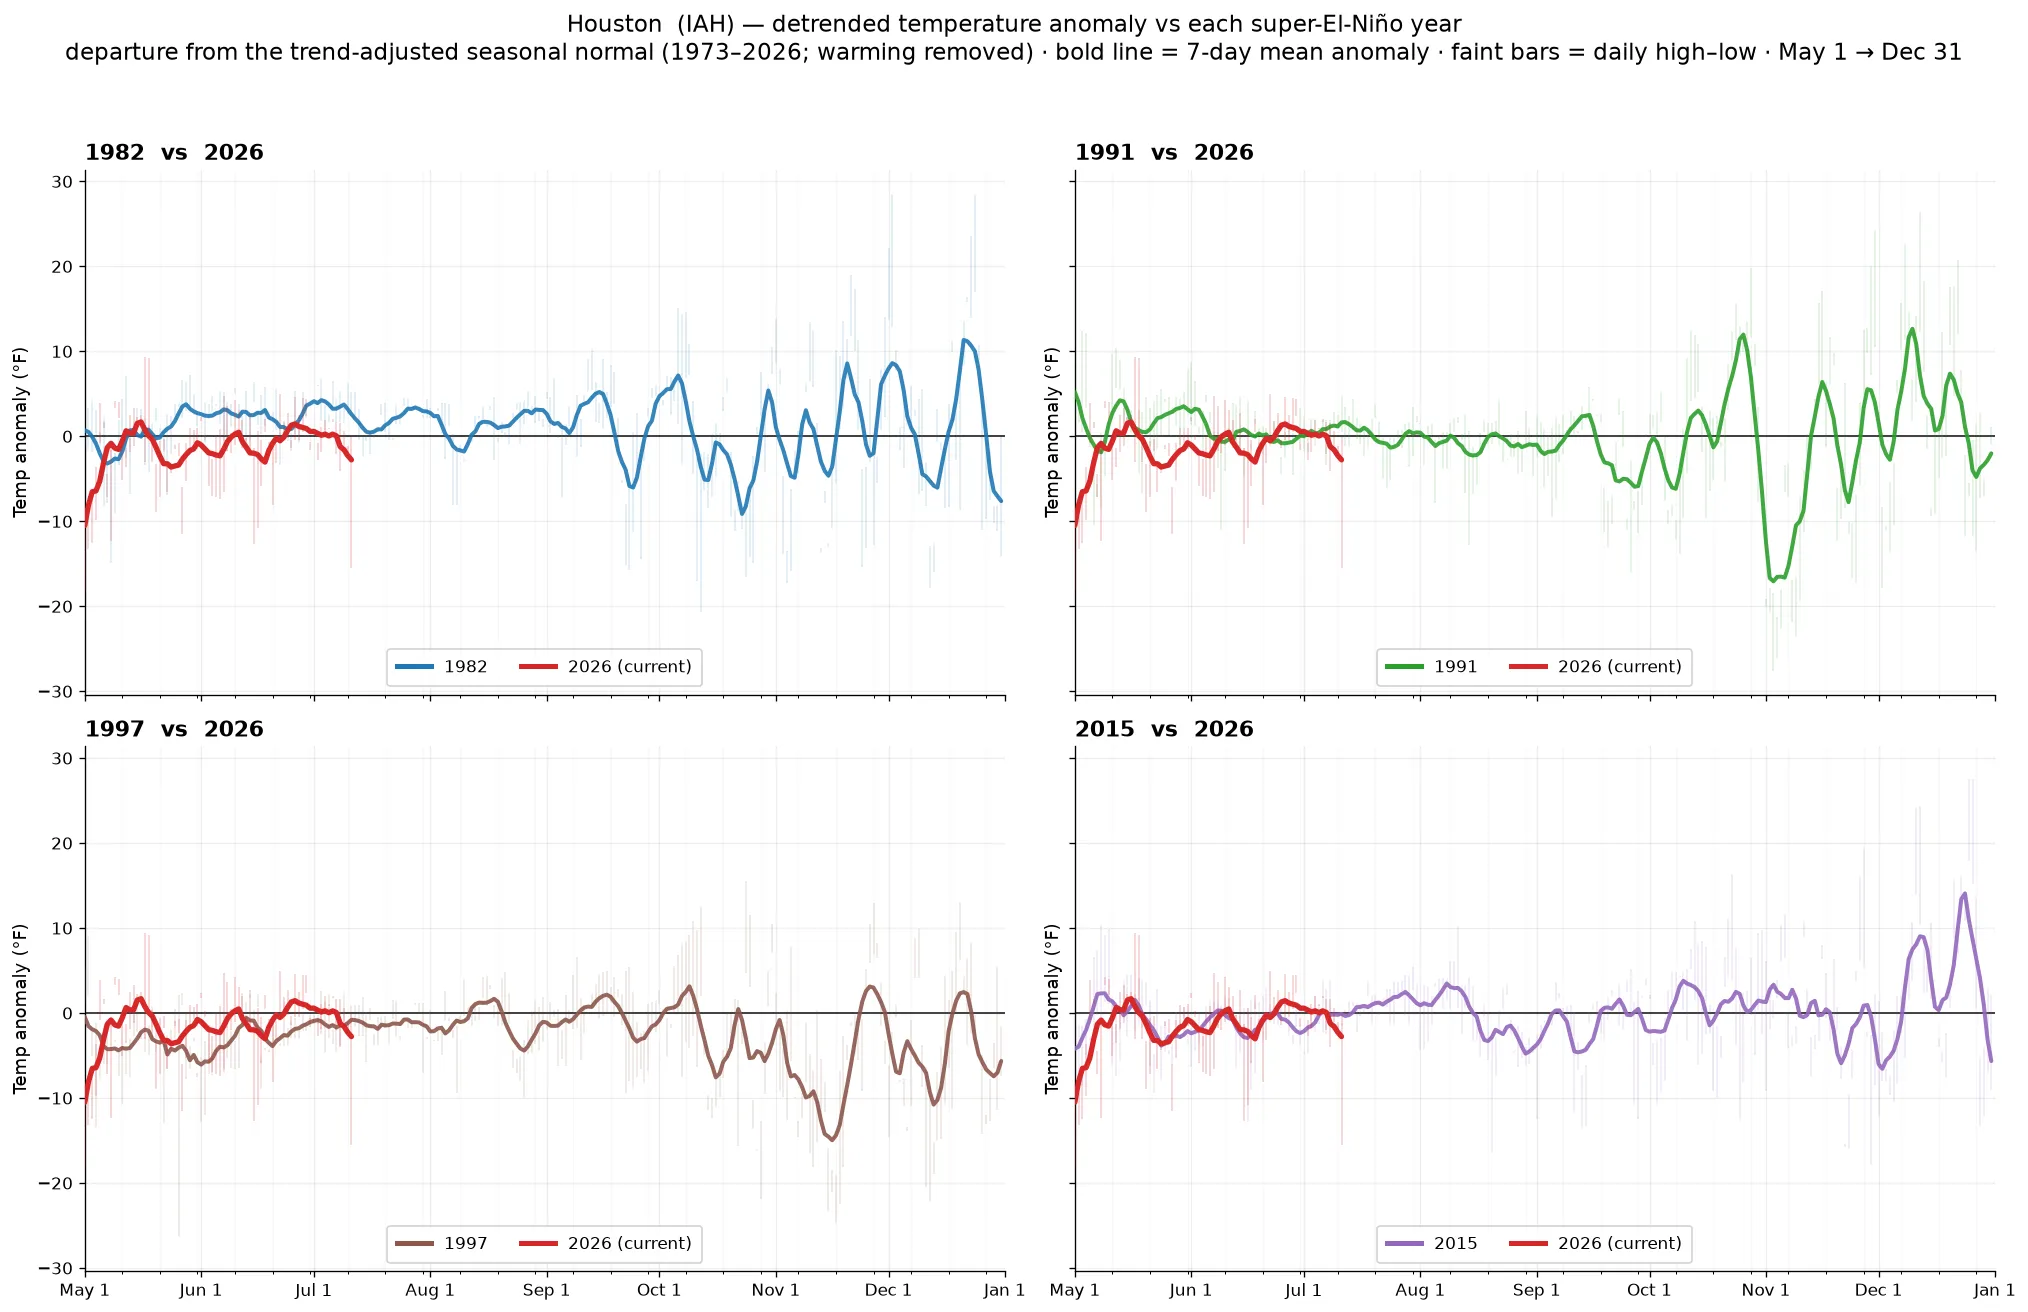
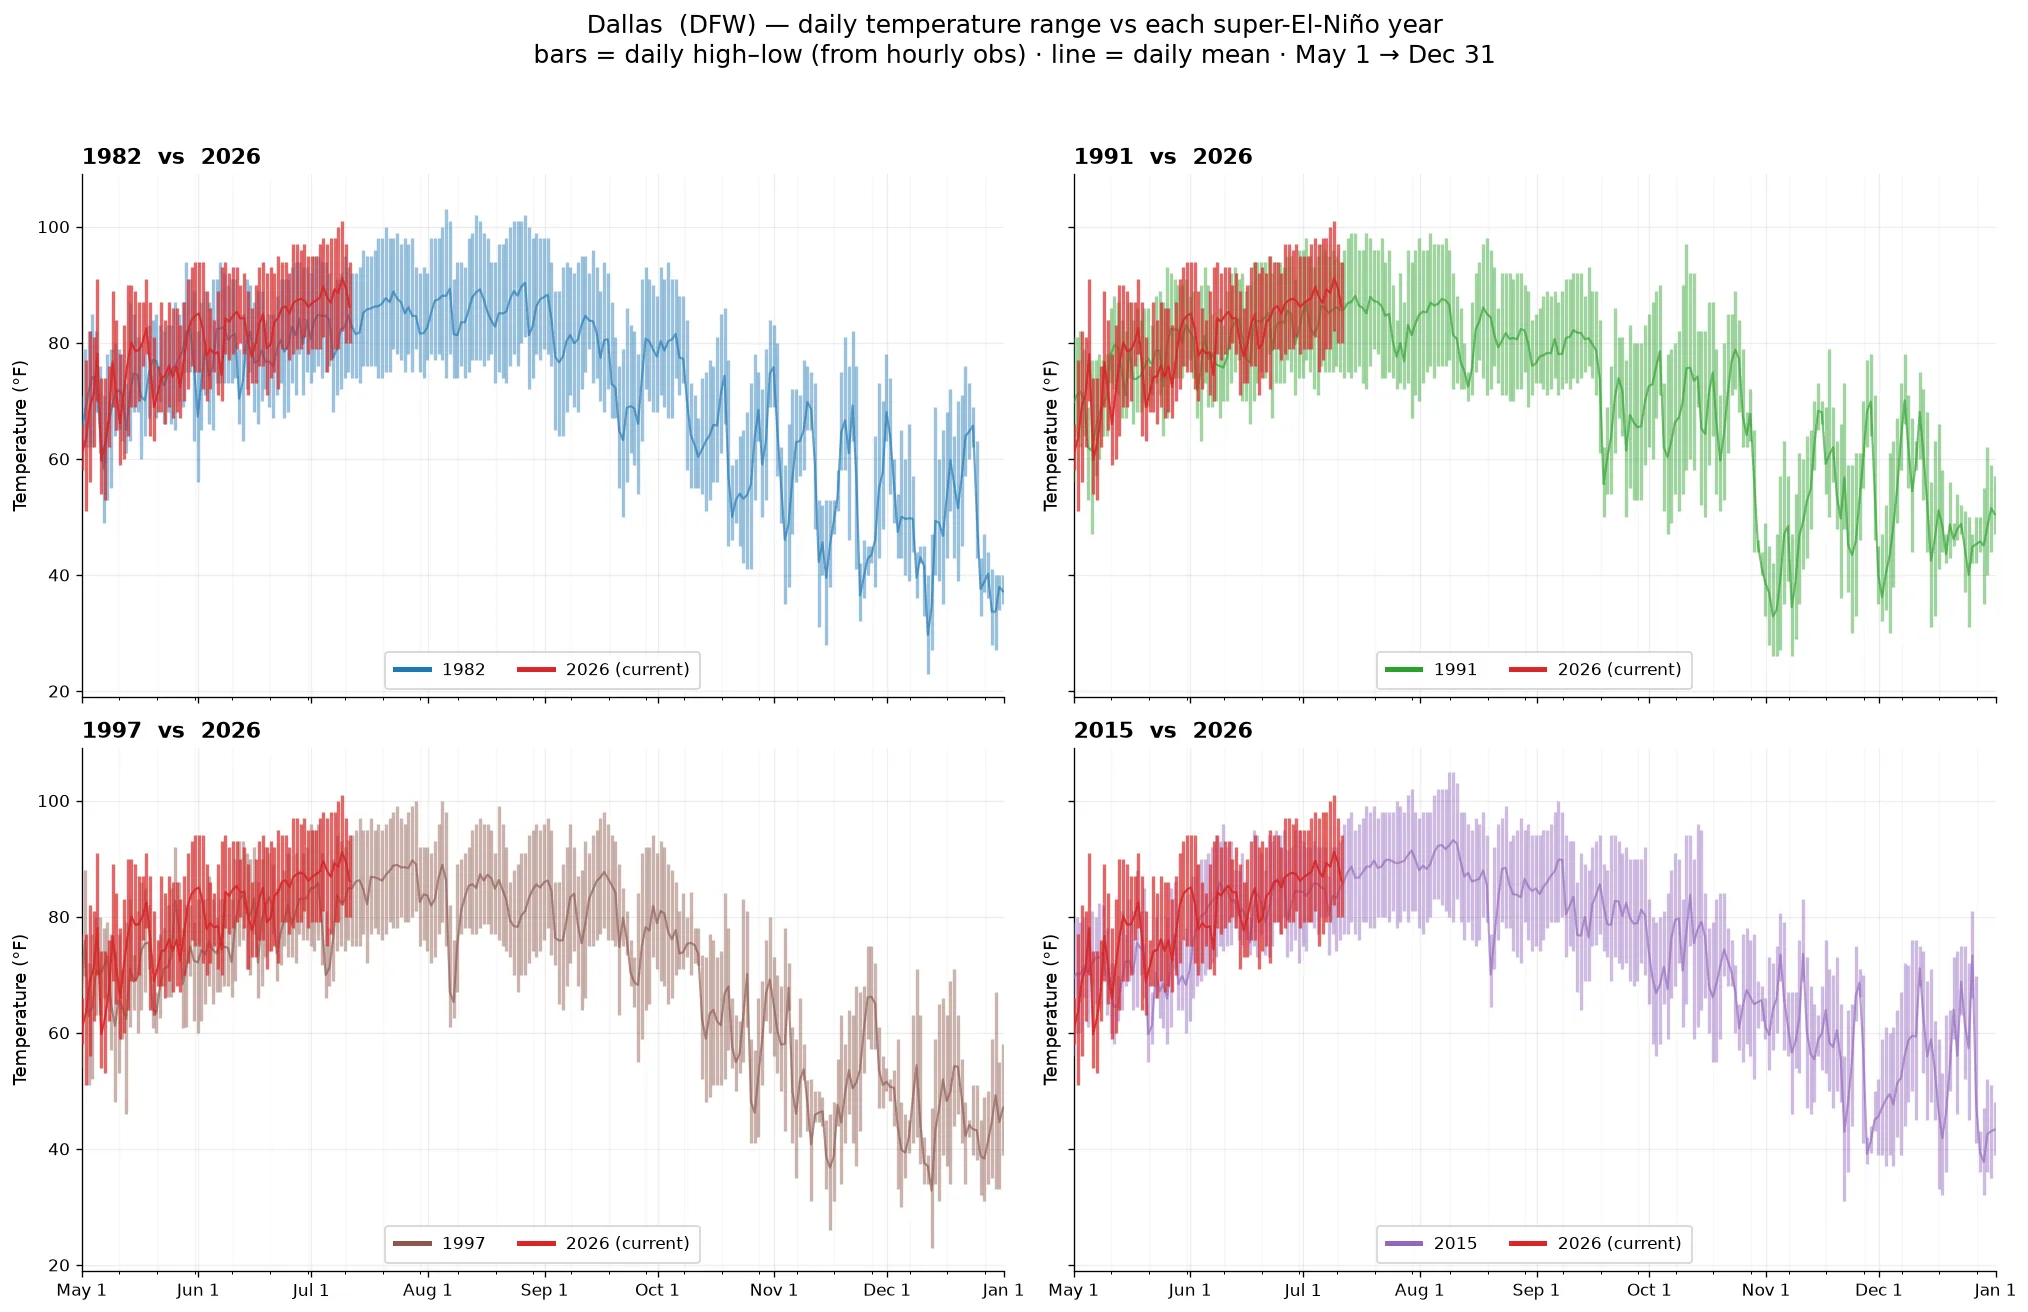
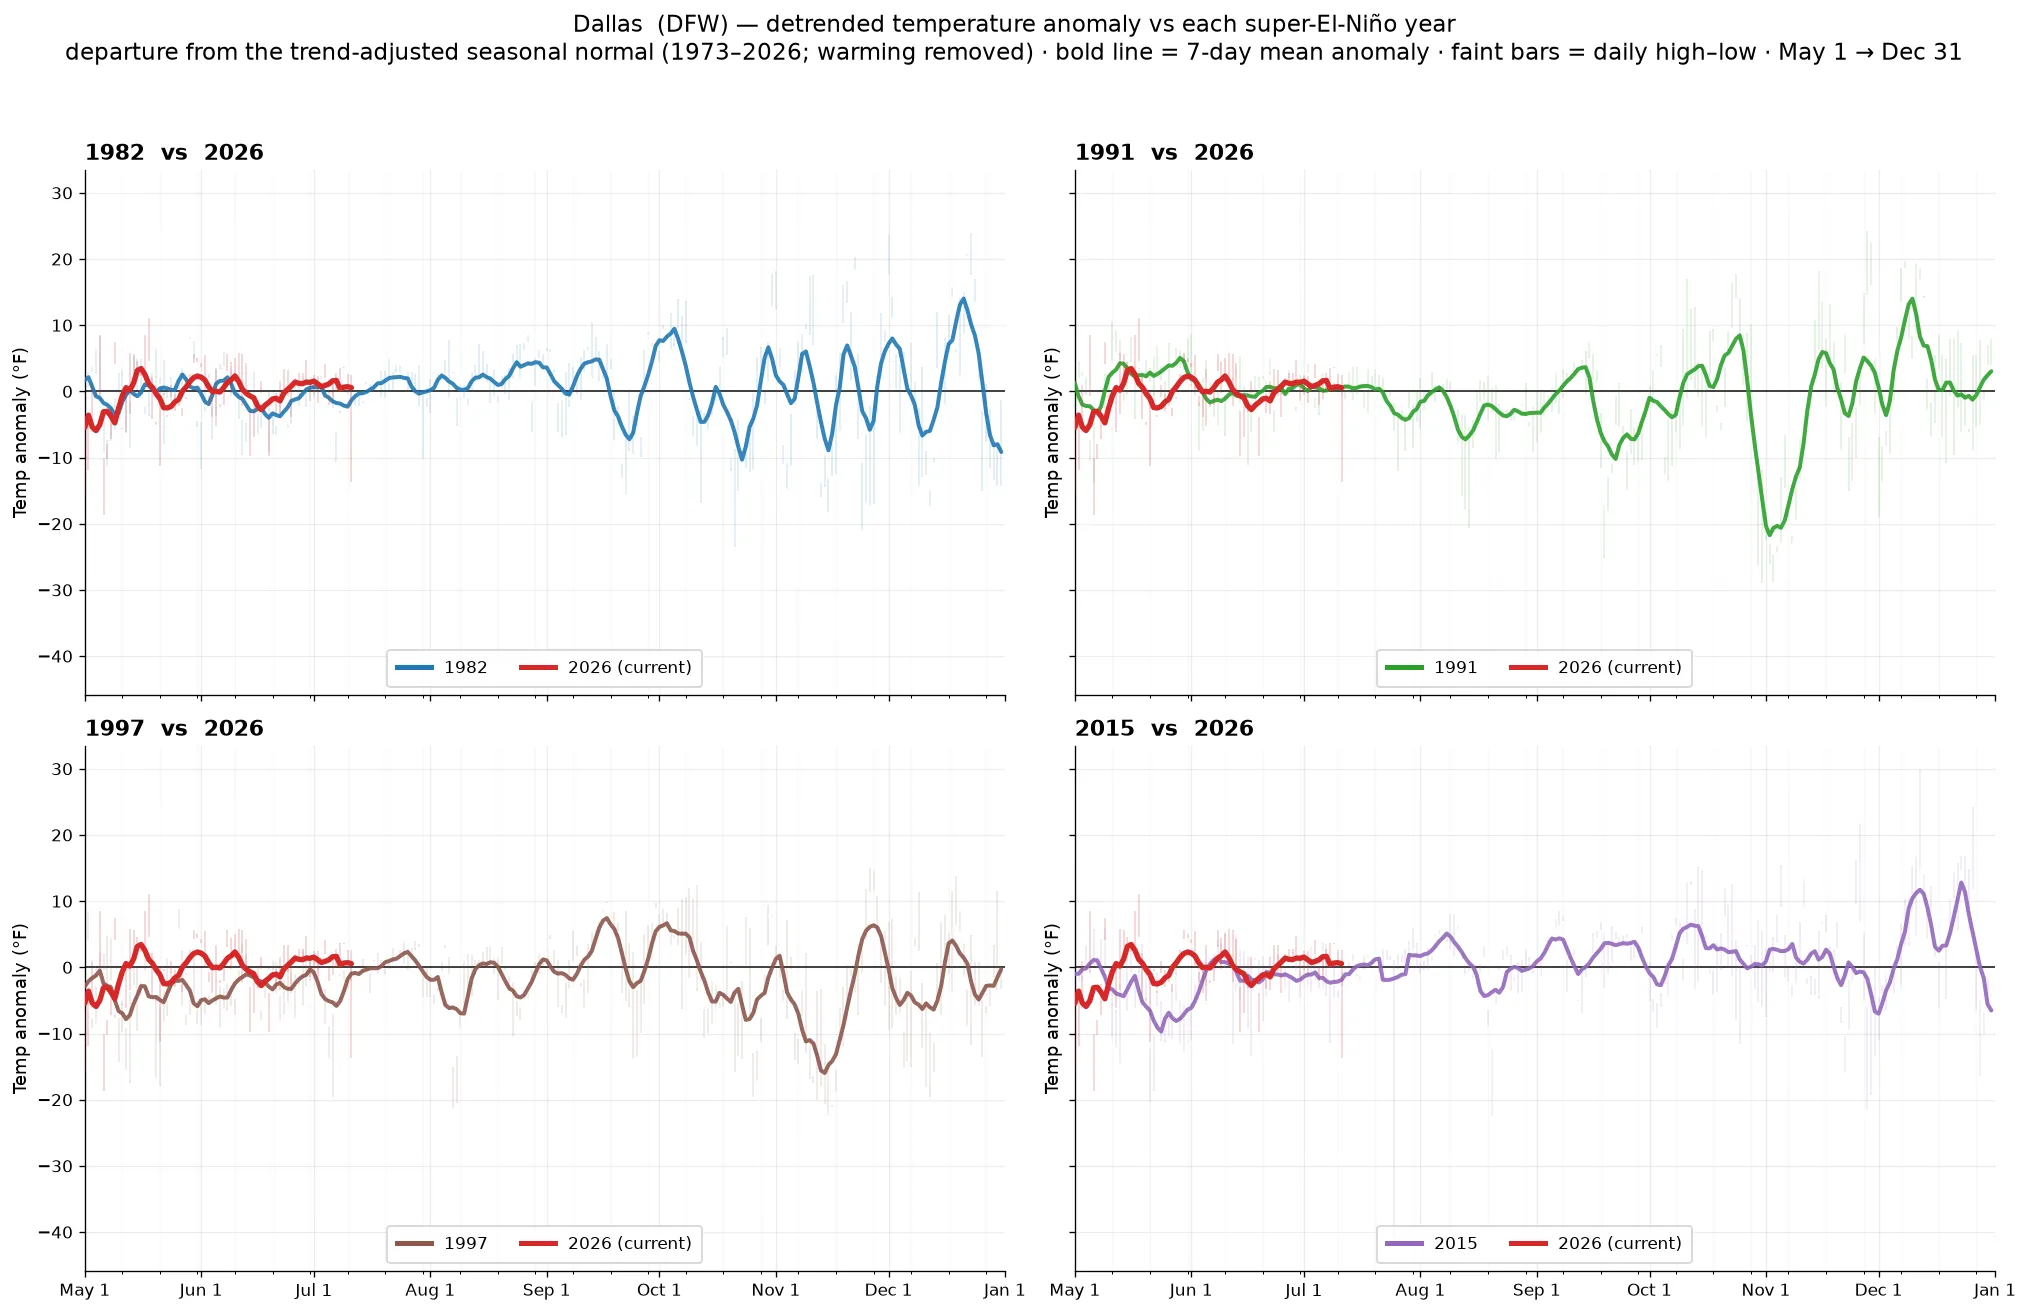
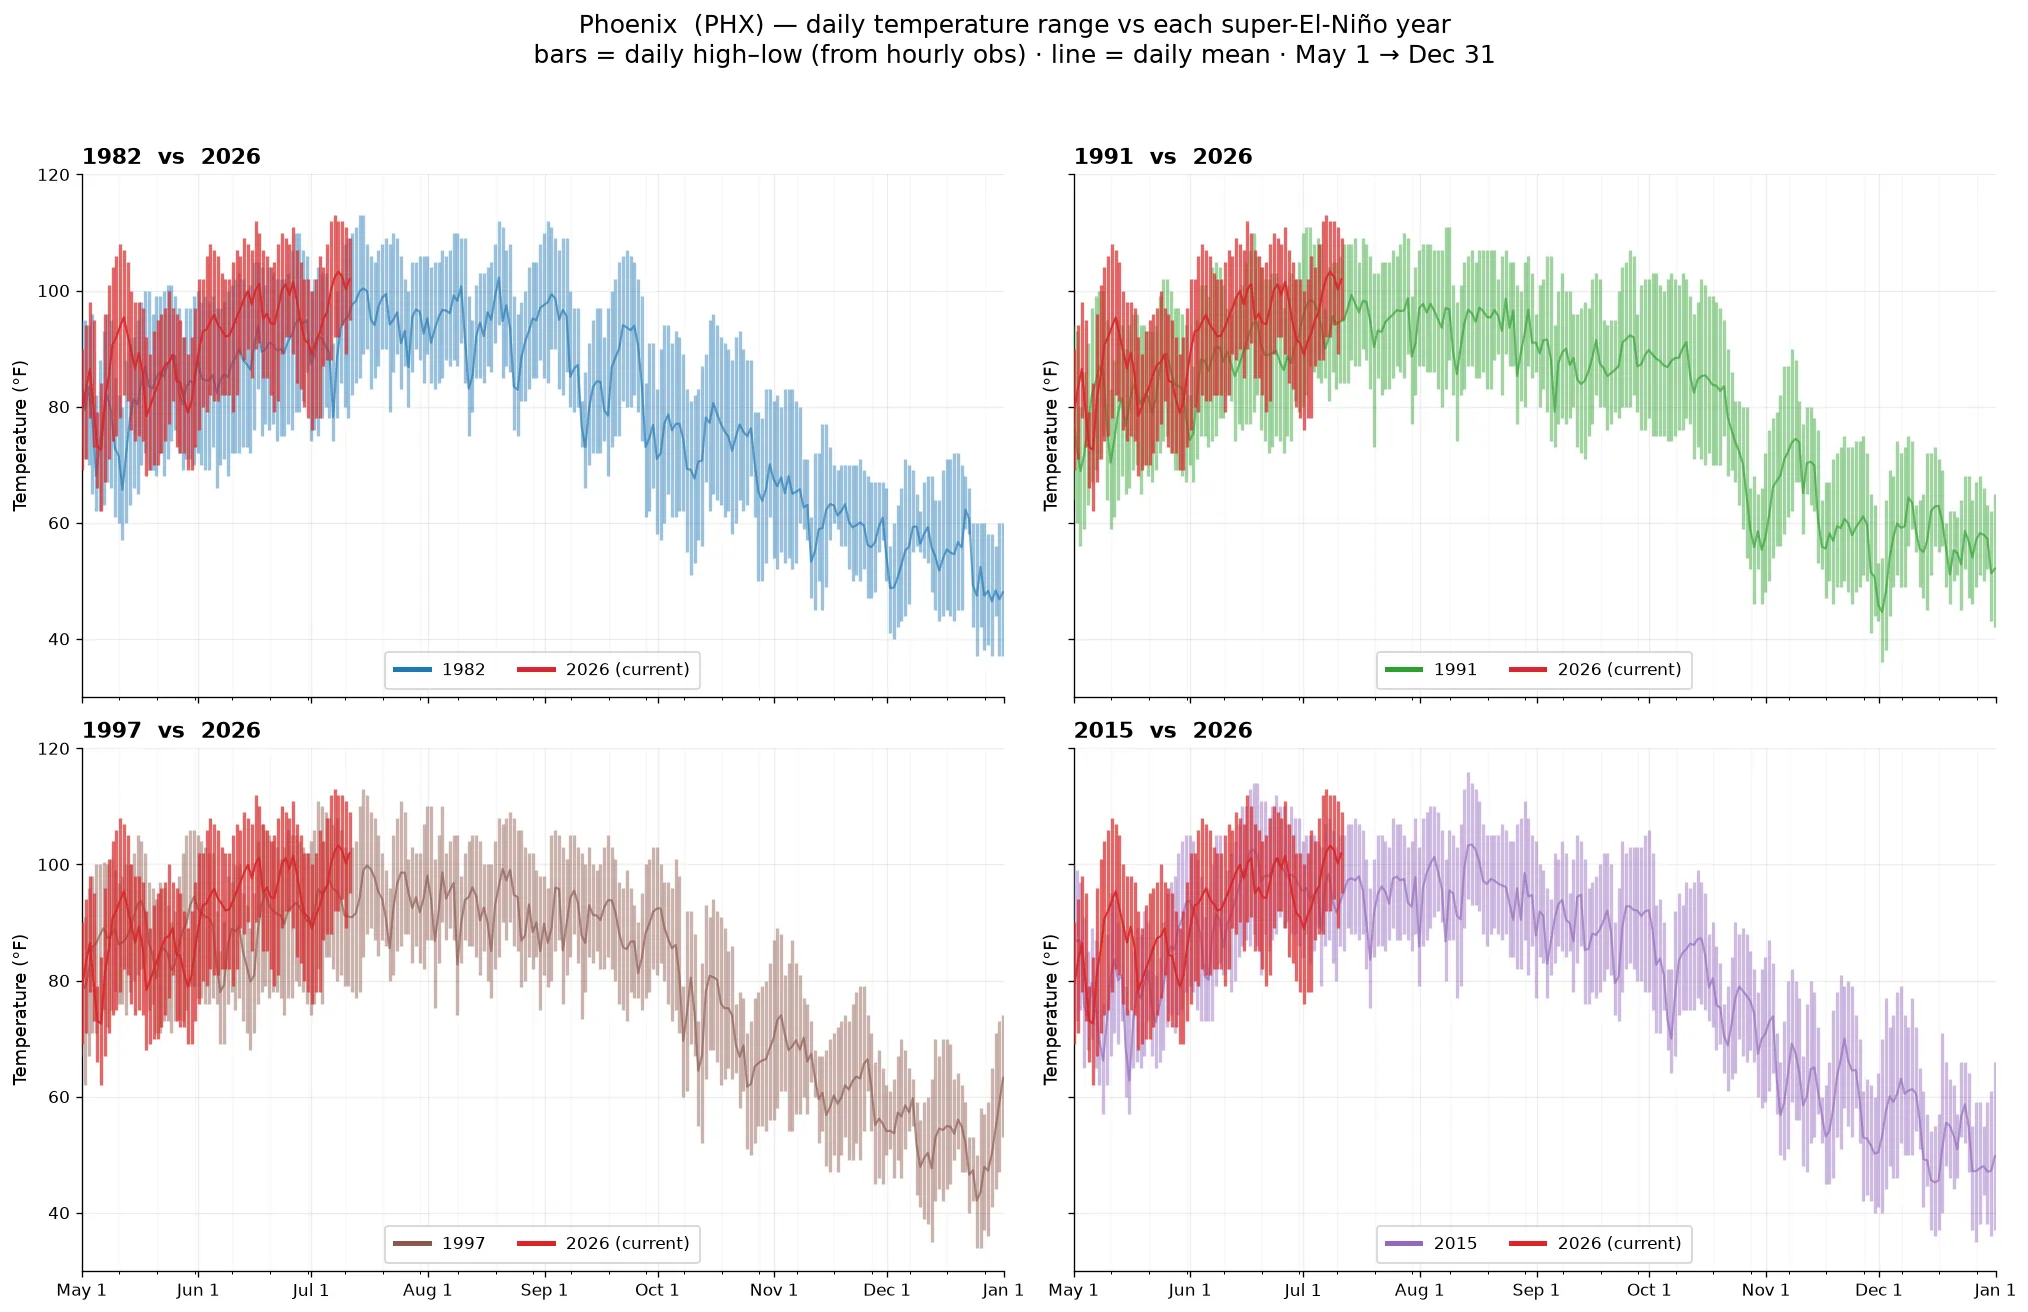
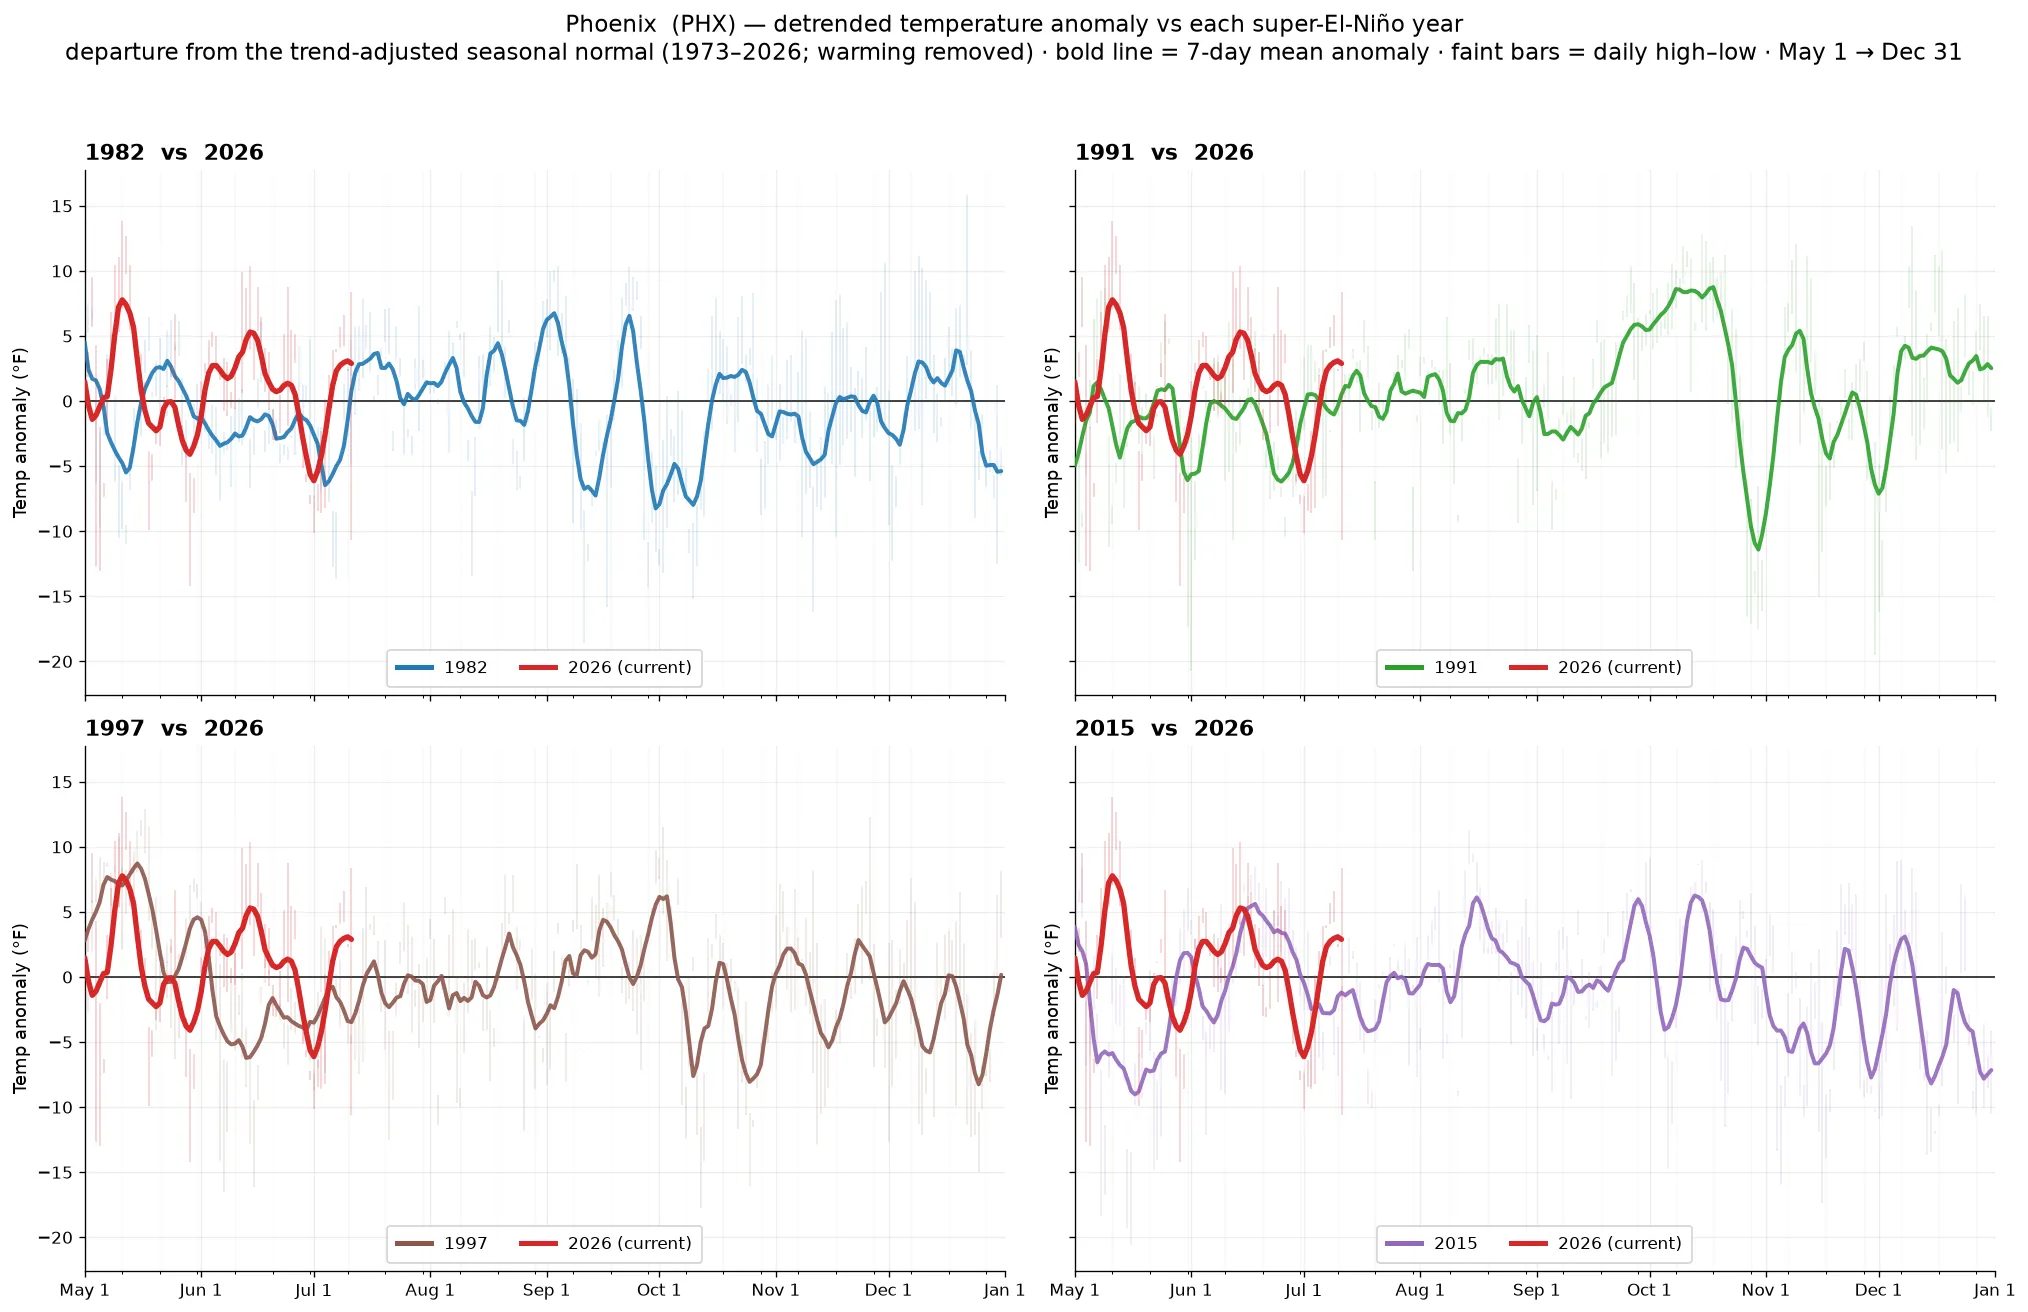
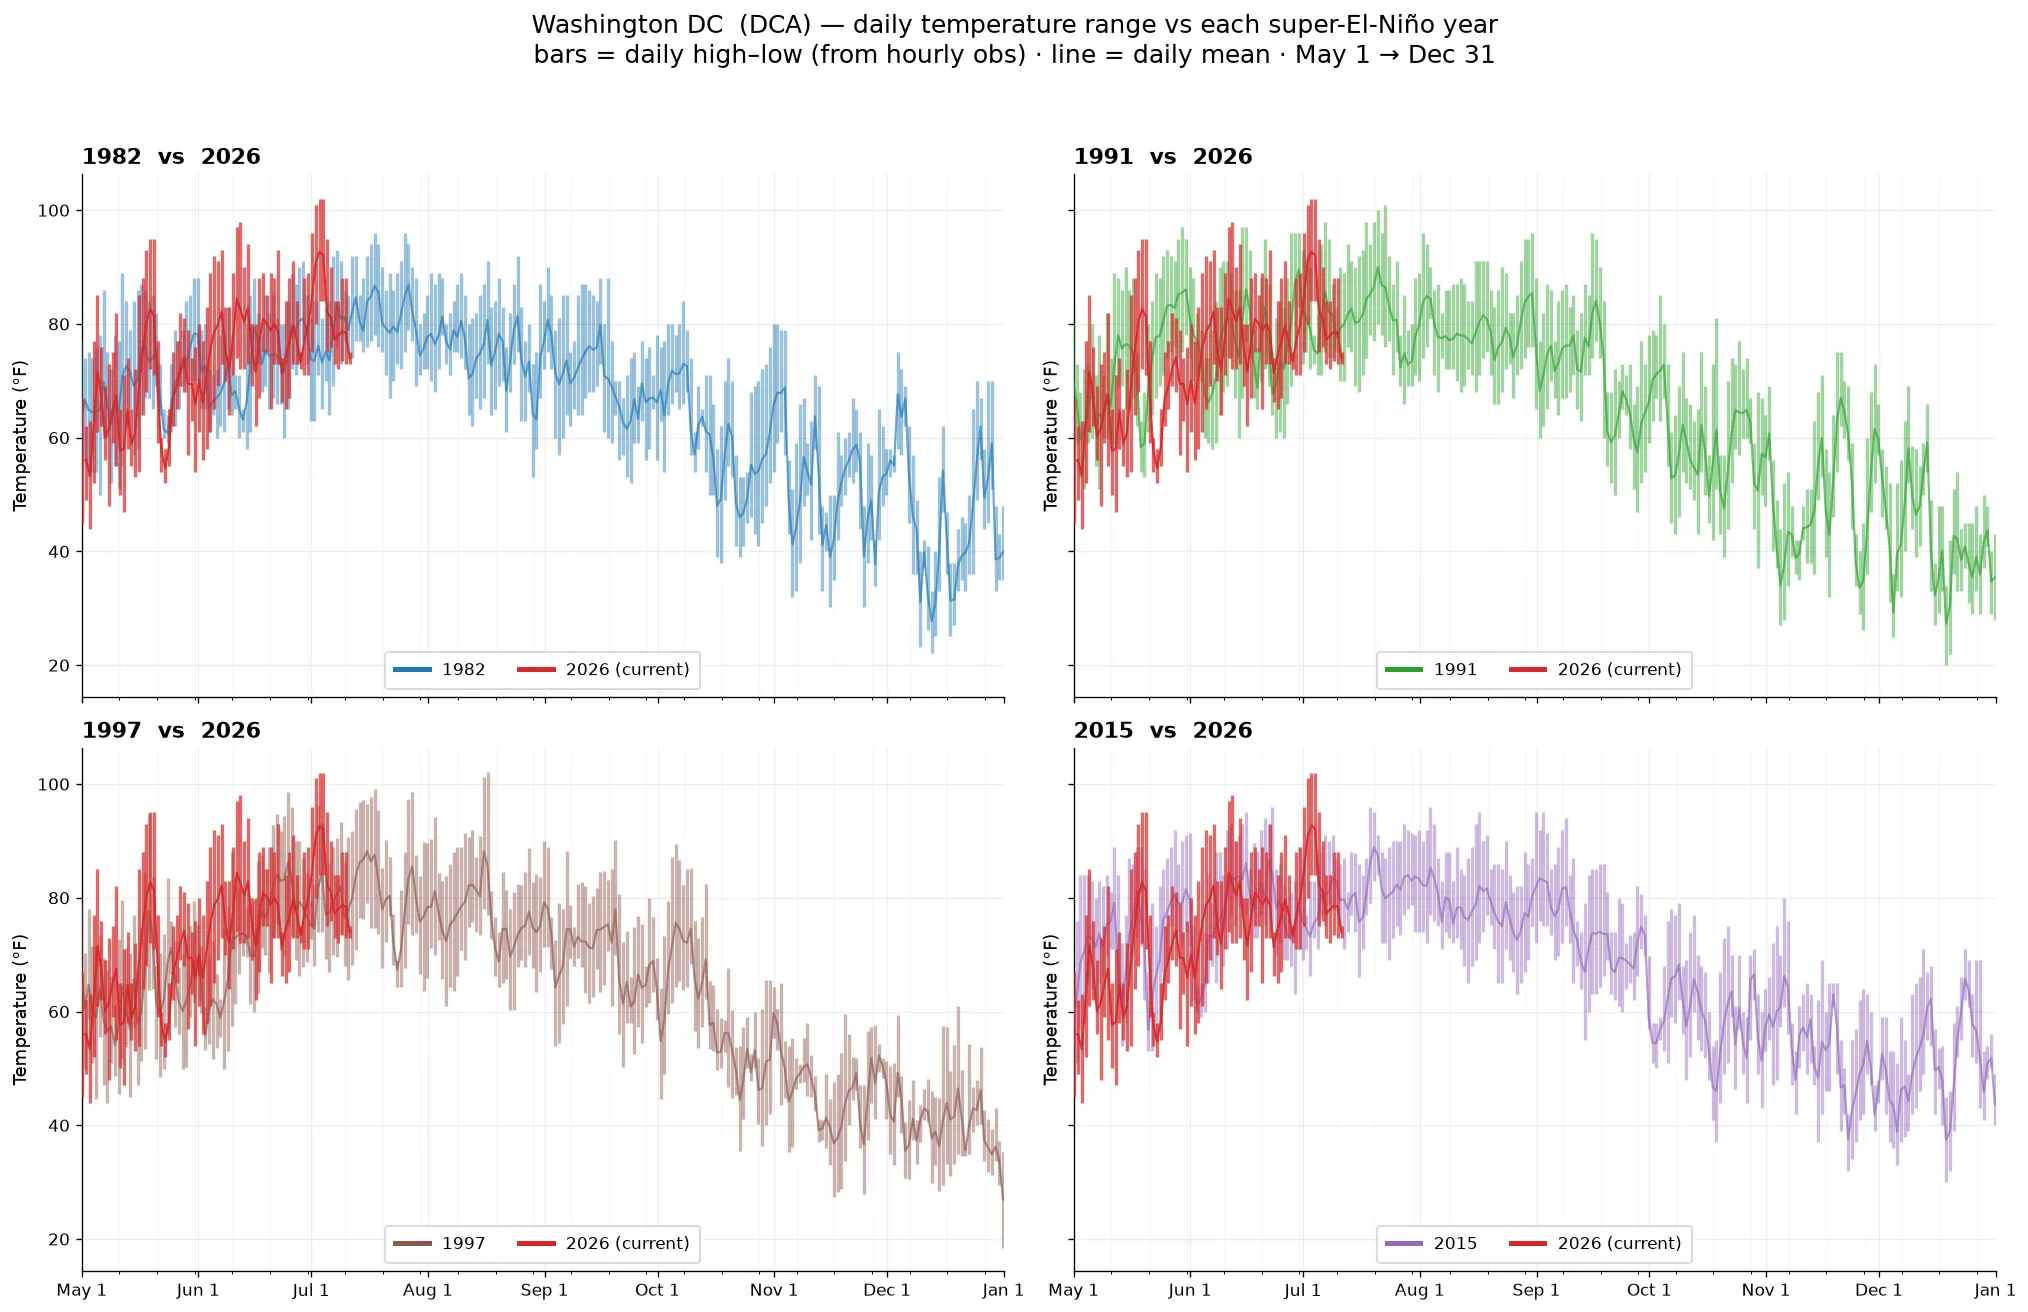
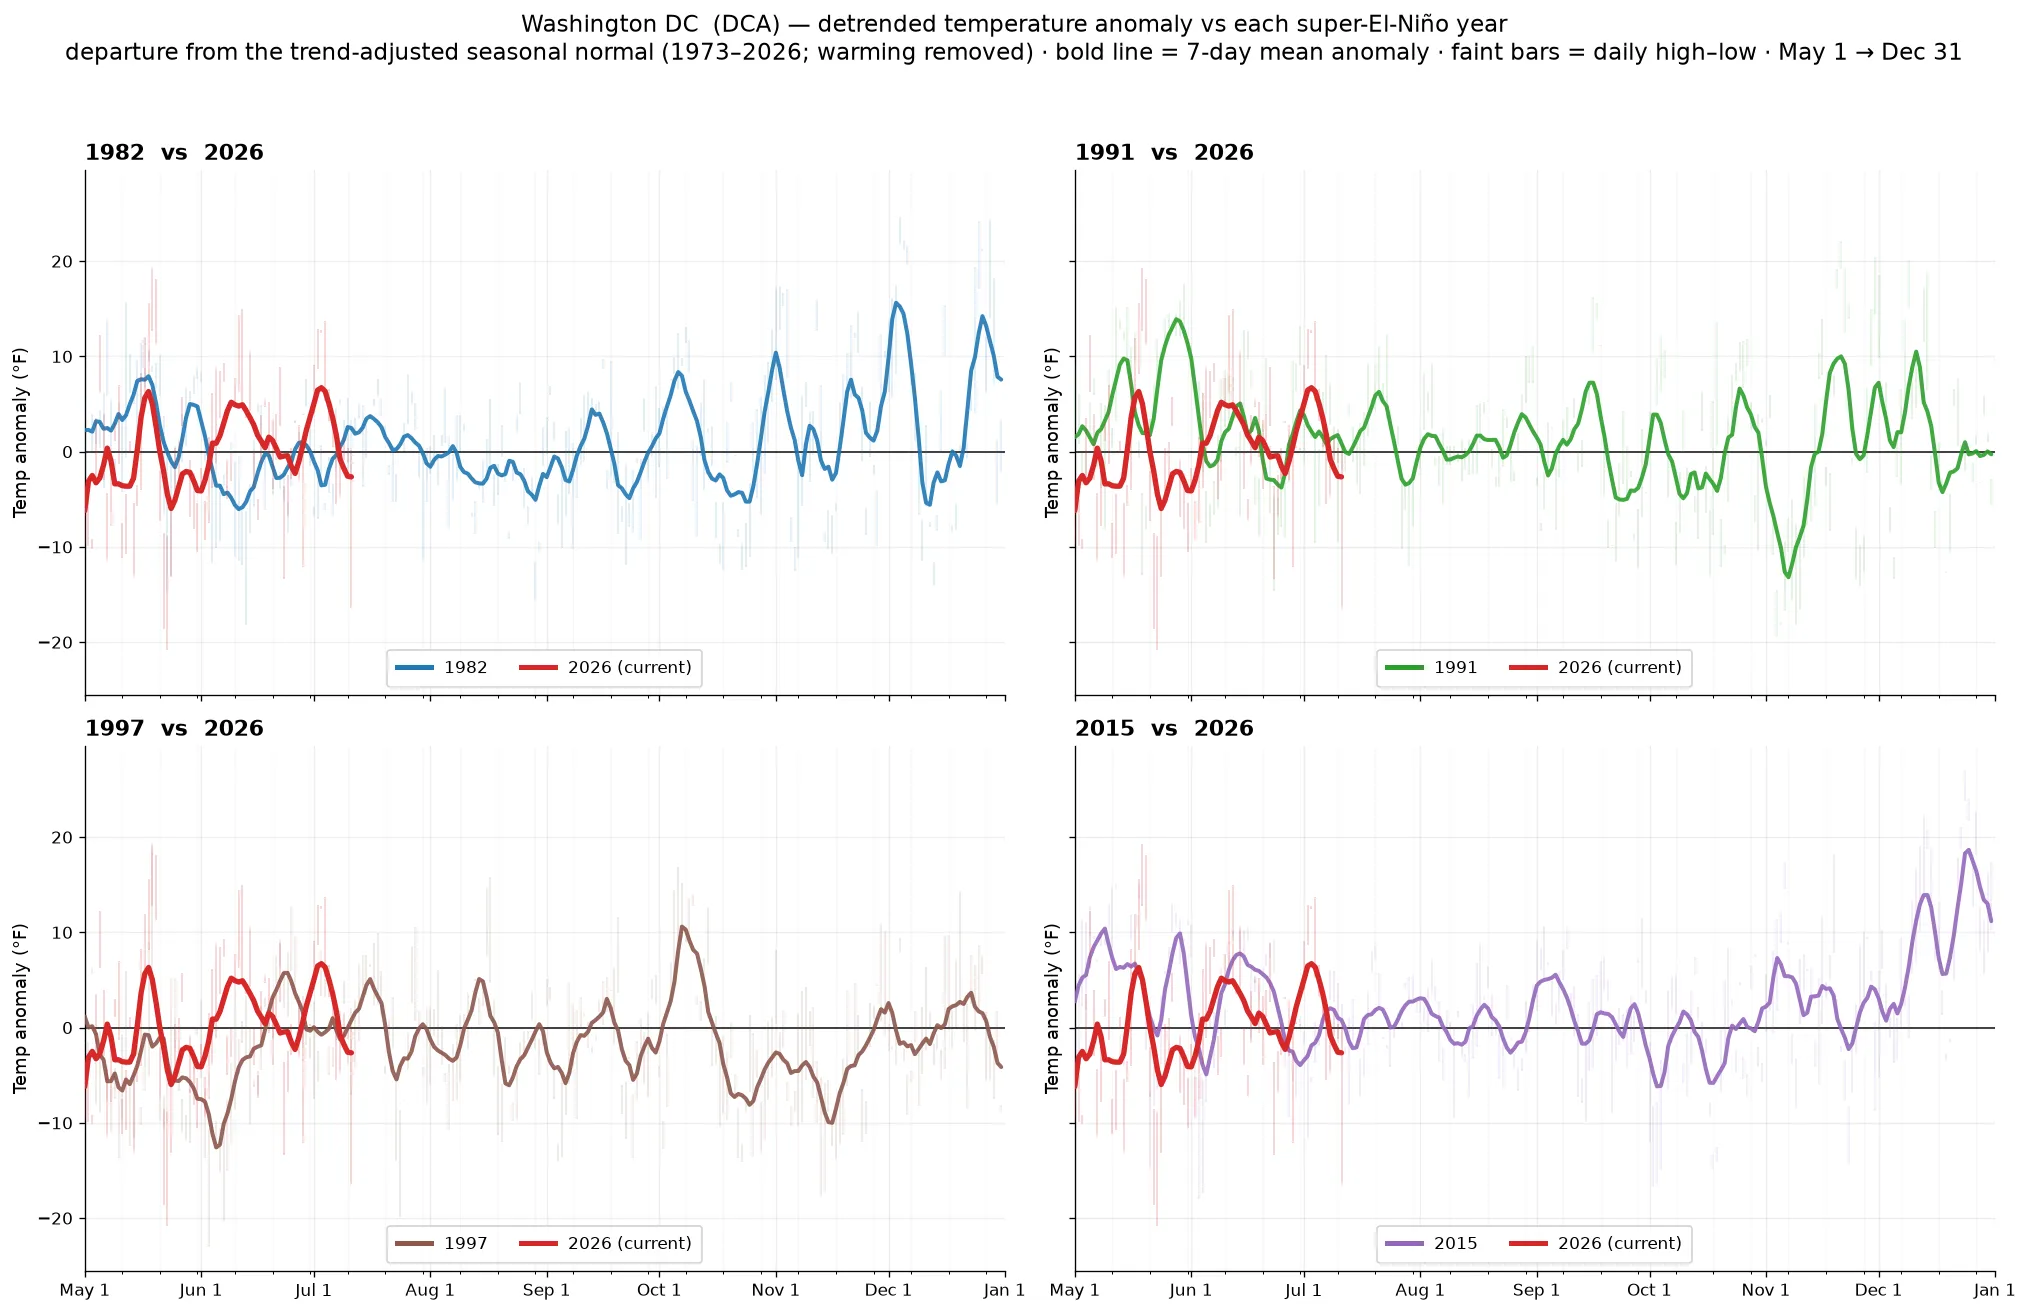
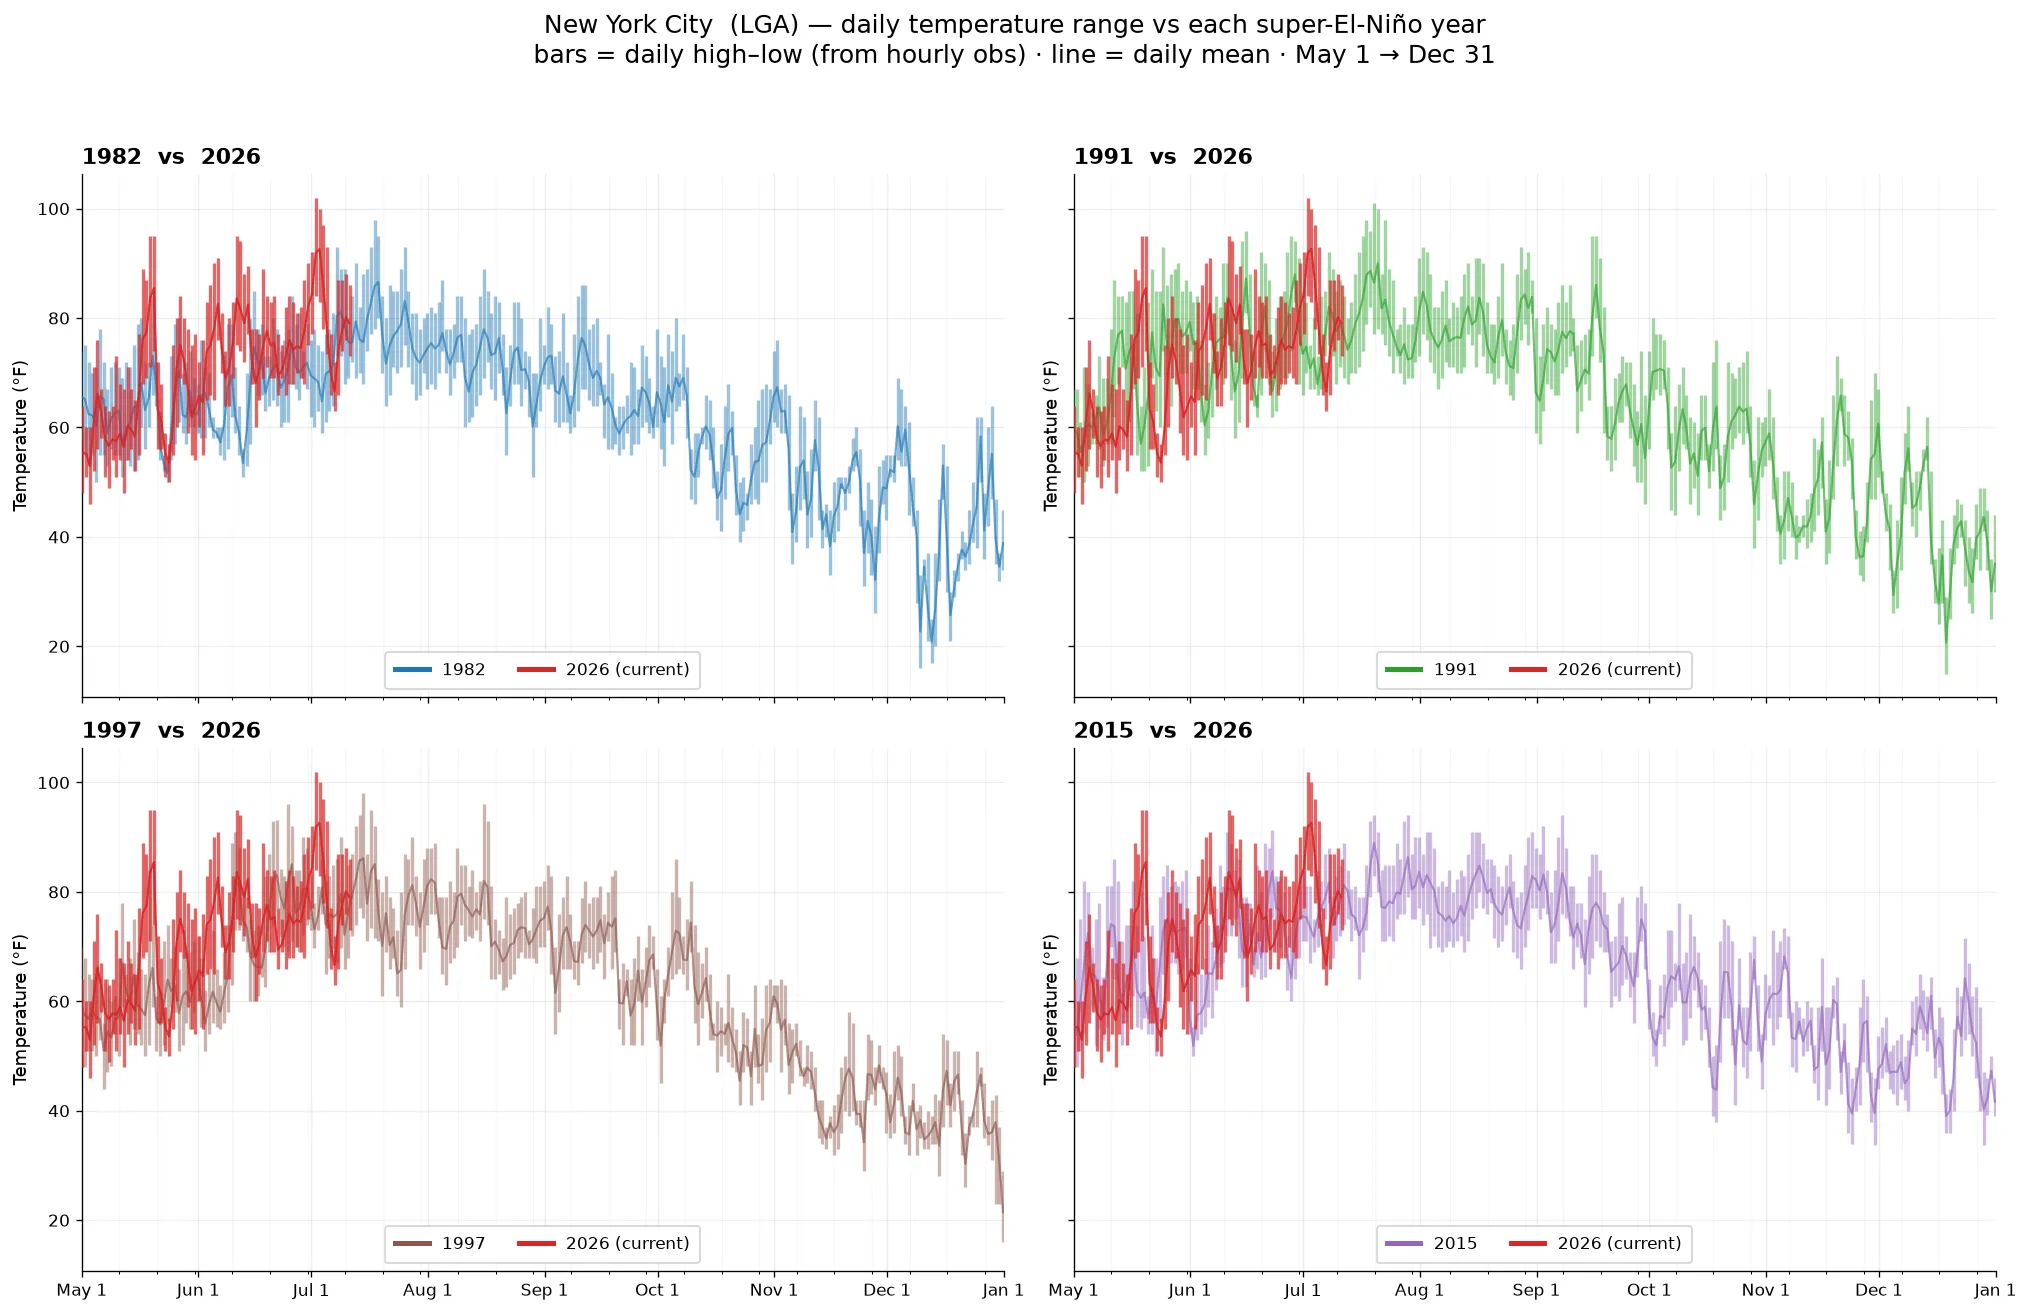
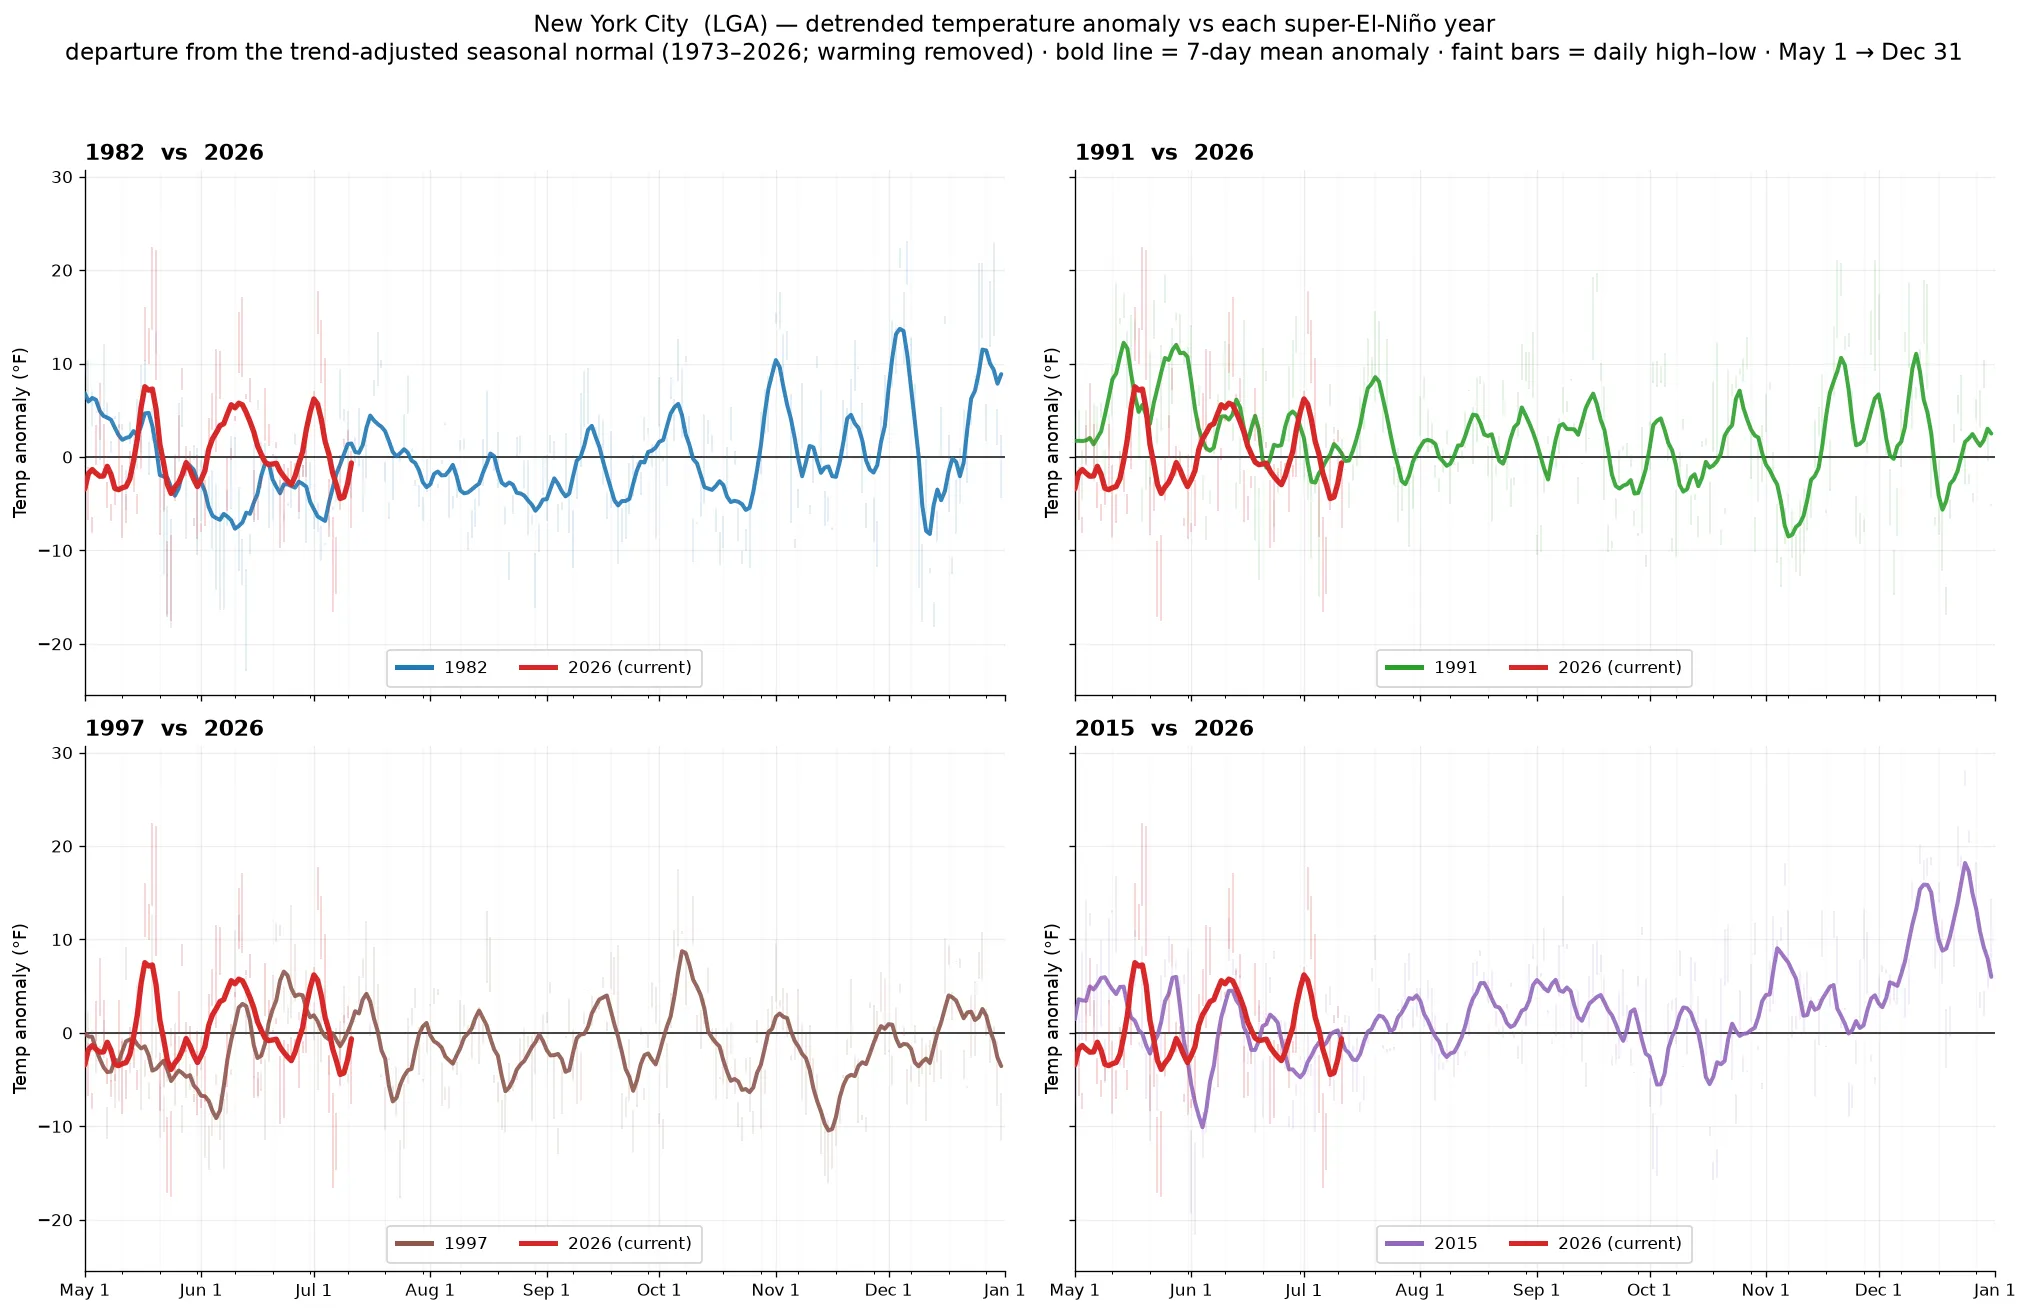
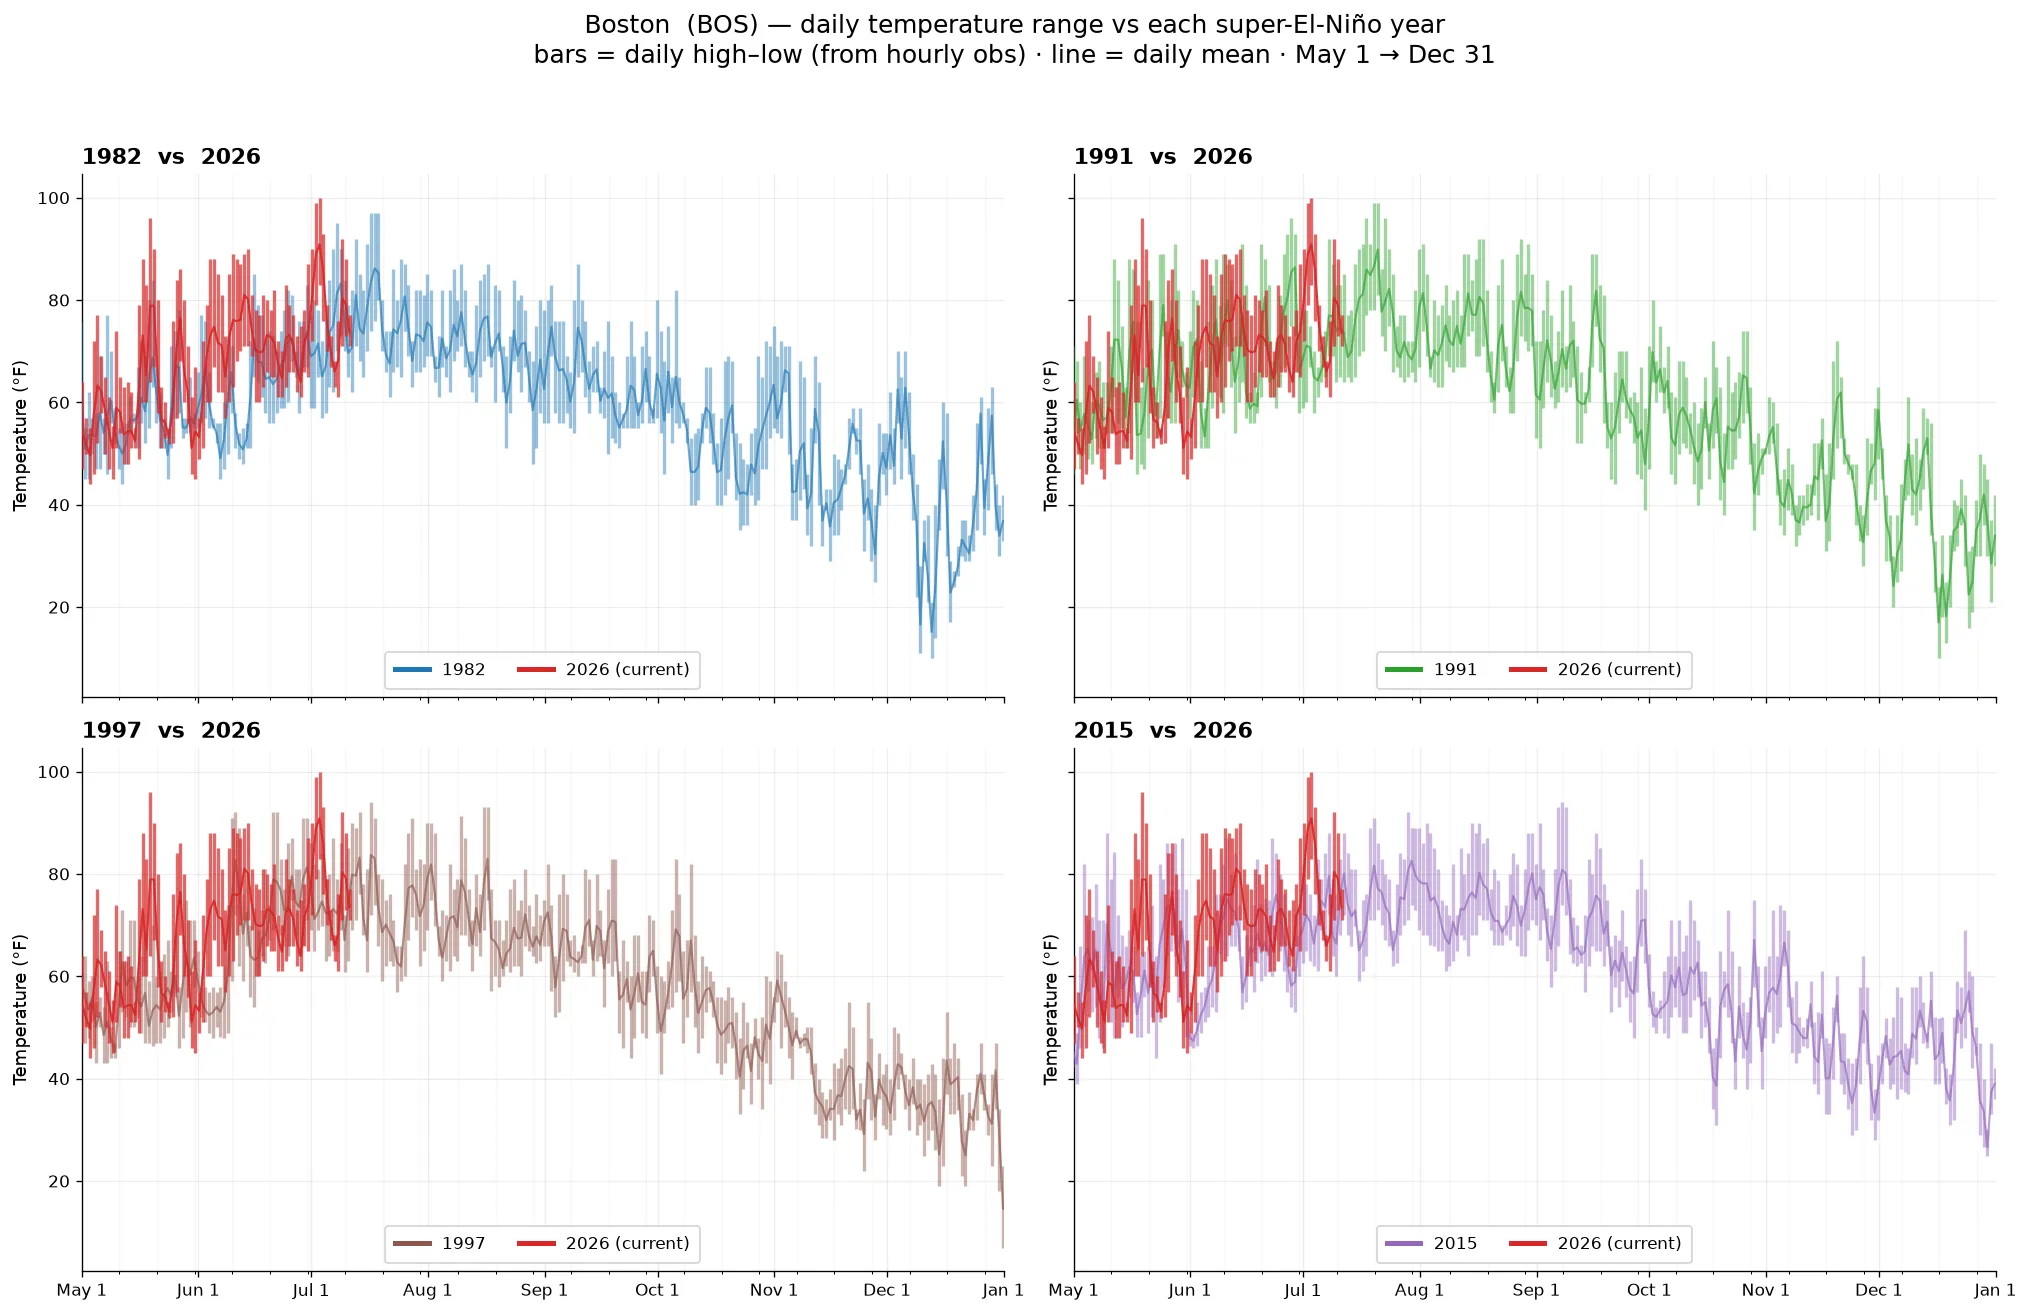
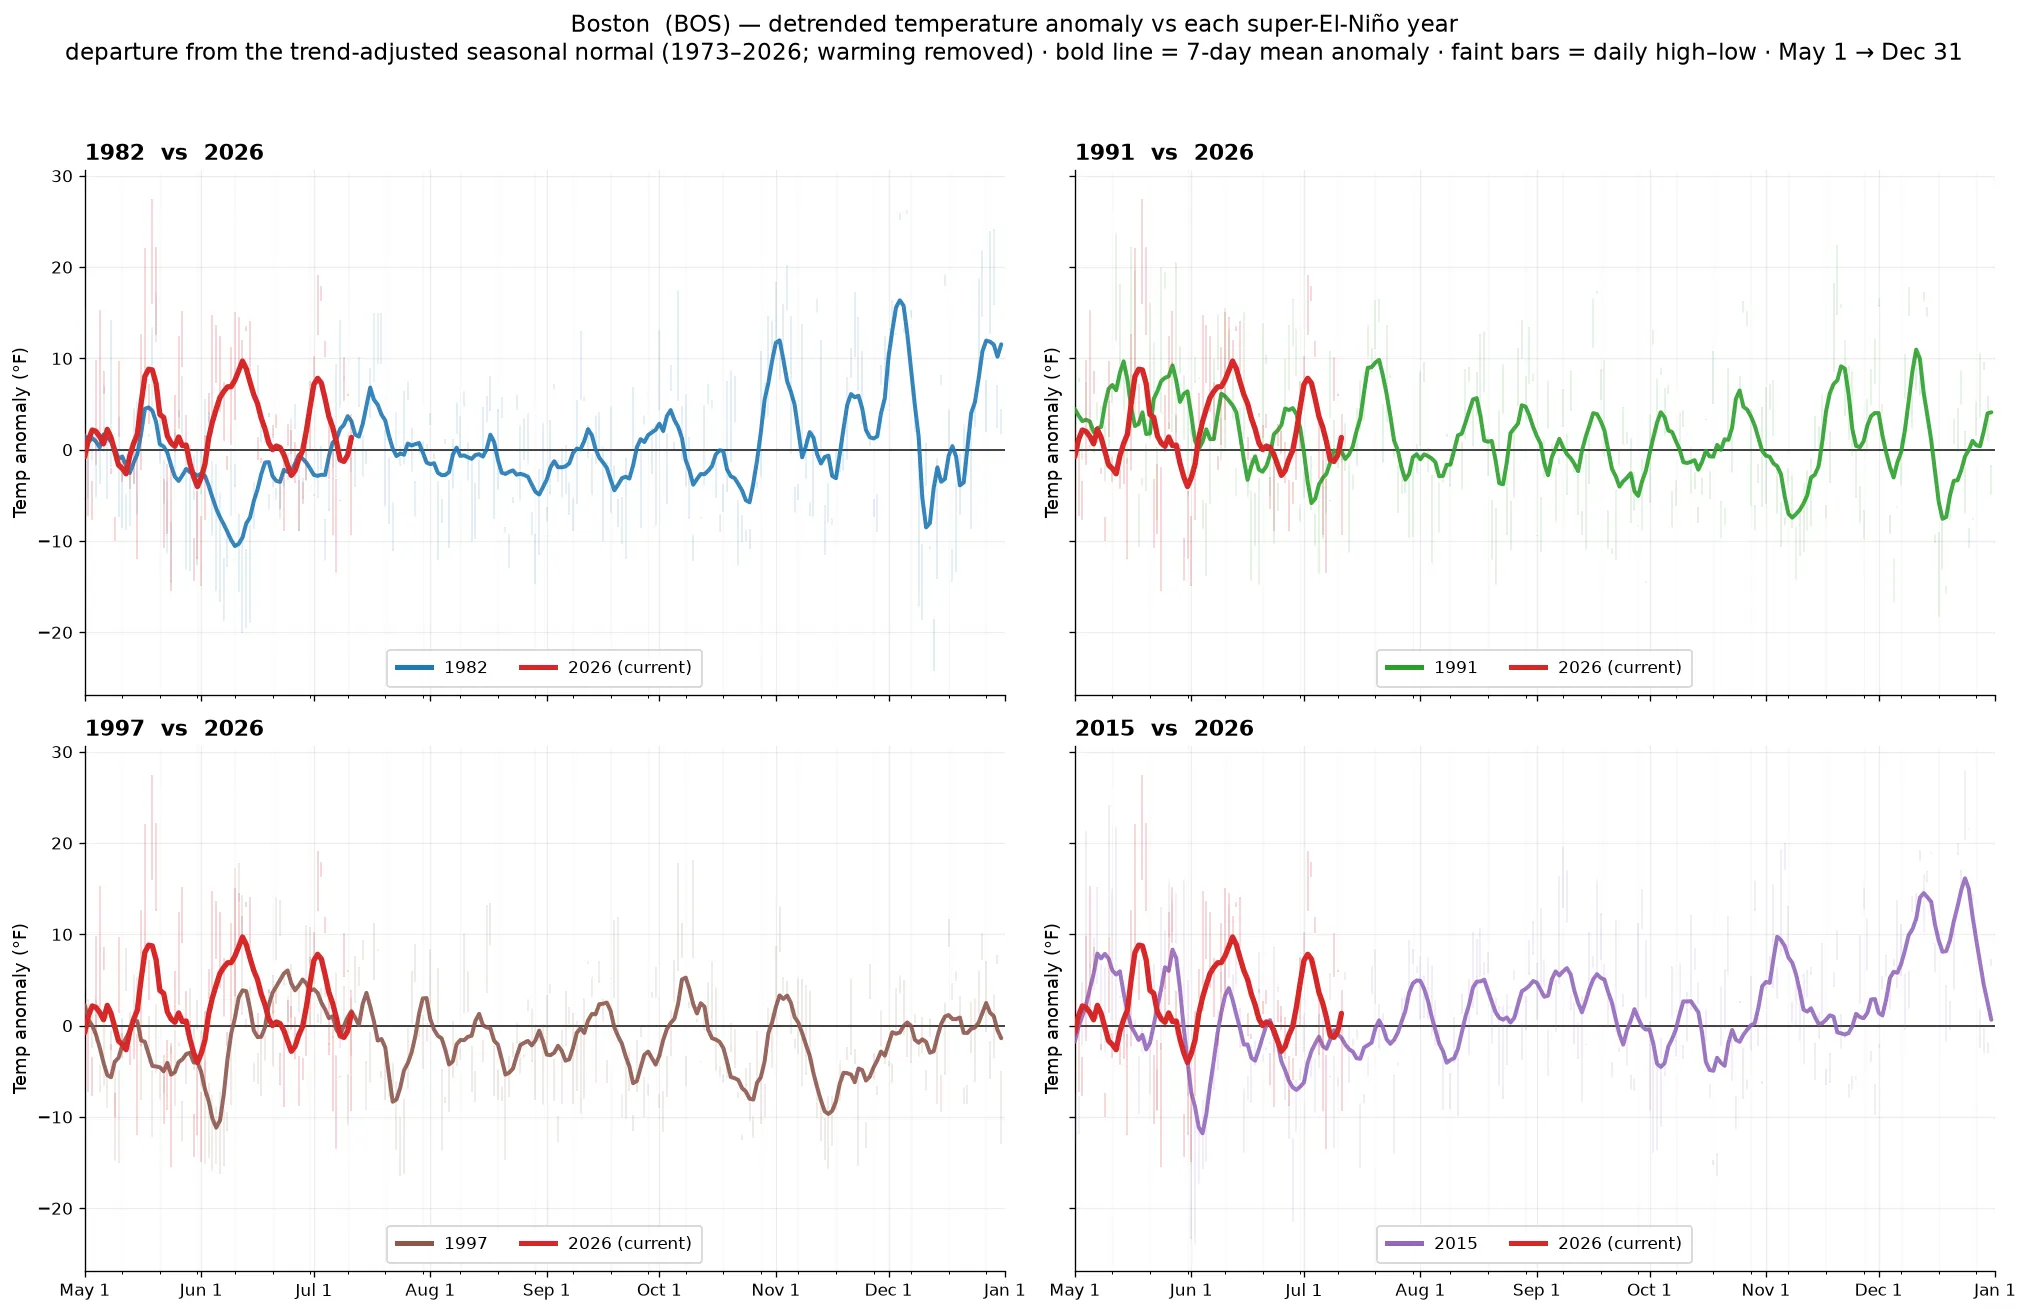
Surface air temperature for eight U.S. cities through May→December of each super El Niño year (1982, 1991, 1997, 2015) and the current 2026 event, from hourly IEM ASOS station observations. For each city, the top panel shows the absolute daily high–low range (bars) and daily mean (line); the bottom panel recasts it as a detrended anomaly, the departure from that station's trend-adjusted seasonal normal, with the long-term warming trend removed so each El Niño is measured against its own era's climate. The current 2026 line runs through the latest available day.
Houston & Dallas
Phoenix & Washington, DC
New York City & Boston
Portland & Seattle