Equatorial Pacific Subsurface Temperature
Depth–longitude cross-sections along the equator from the TAO/TRITON moored-buoy array. The subsurface warm reservoir along the thermocline often leads the surface ENSO signal.
Interactive Cross-Section Explorer
The equatorial depth–longitude section as an explorable chart: hover any point for the exact temperature and anomaly, scrub through the last ~4 months, and switch between the full temperature field and its anomaly versus 1991–2020. Markers show the actual TAO/TRITON moorings the section is built from — ▼ green buoys reported within the last week, ▼ grey are currently silent; the dotted columns mark each buoy's real sensor depths. Everything between moorings is interpolation — the markers show exactly where the ocean is truly being measured.
Equatorial Pacific Subsurface Temperature
Depth–longitude cross-section along the equator (0°N) from the TAO/TRITON moored-buoy array: temperature (top) and its anomaly versus the 1991–2020 average (bottom), 5-day smoothed. The thermocline (here the 26°C and 28°C isotherms, with the 20°C isotherm in solid black and the 10°C isotherm dashed blue when it enters the section) tilts upward toward the east, and subsurface anomalies along it often lead the surface ENSO signal.
Recharge Oscillator — Where Are We in the ENSO Cycle?
The equatorial Pacific's warm water volume (WWV — the volume of water warmer than 20°C, 5°S–5°N, official PMEL index) plotted against the Niño-3.4 SST anomaly. In the recharge-oscillator view of ENSO the system orbits this plane counterclockwise: heat builds along the thermocline (top), discharges into an El Niño (right), leaves the basin depleted (bottom), and recharges through La Niña (left). Because WWV leads Niño-3.4 by two to three seasons, the current vertical position is a genuine glimpse ahead. Grey: every month since 1980; colored loops: benchmark El Niño events; red: the last 24 months.
Tropical Pacific Surface Currents
Daily surface-current fields over the last month for the equatorial Pacific (15°S–15°N, 130°E–80°W) from the Copernicus Marine 1/12° ocean model: speed shaded (blue slow to red fast) with streamlines tracing the flow. The westward South Equatorial Current straddles the equator, the eastward North Equatorial Counter Current sits near 5–10°N, and Tropical Instability Wave eddies ripple along the cold tongue.
Equatorial Zonal Current & the Undercurrent
Depth–longitude slice along the equator (1.5°S–1.5°N), 160°E–90°W, from the Copernicus Marine 1/12° global ocean model: zonal current (shaded, eastward in red) with the 20°C isotherm (the thermocline) in black. It resolves the Equatorial Undercurrent, the eastward subsurface jet at about 50–200 m, the surface-westward South Equatorial Current, and the east–west thermocline tilt. The loop is pinned to start 1 March 2026 and grows daily, so downwelling Kelvin waves (a deepening of the 20°C isotherm with an eastward current pulse) can be followed across the basin.
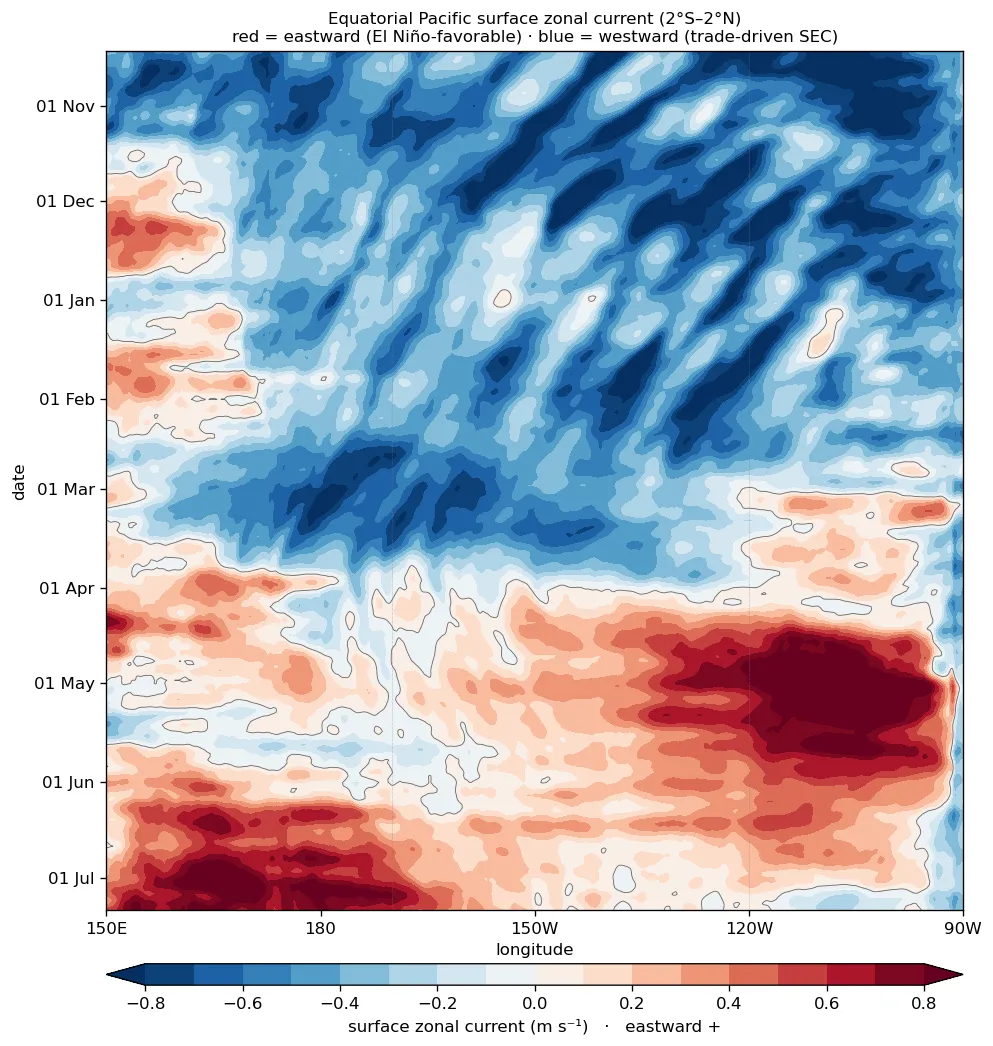
Equatorial Surface Current: Strip / Hovmöller
Longitude × time strip of the daily surface zonal current averaged 2°S–2°N, 150°E–90°W (same Copernicus Marine model). Red is eastward, blue is westward. The equatorial surface normally flows westward (the trade-driven South Equatorial Current); as El Niño matures, downwelling Kelvin waves drive eastward surges into the east Pacific. Newest day at the bottom.
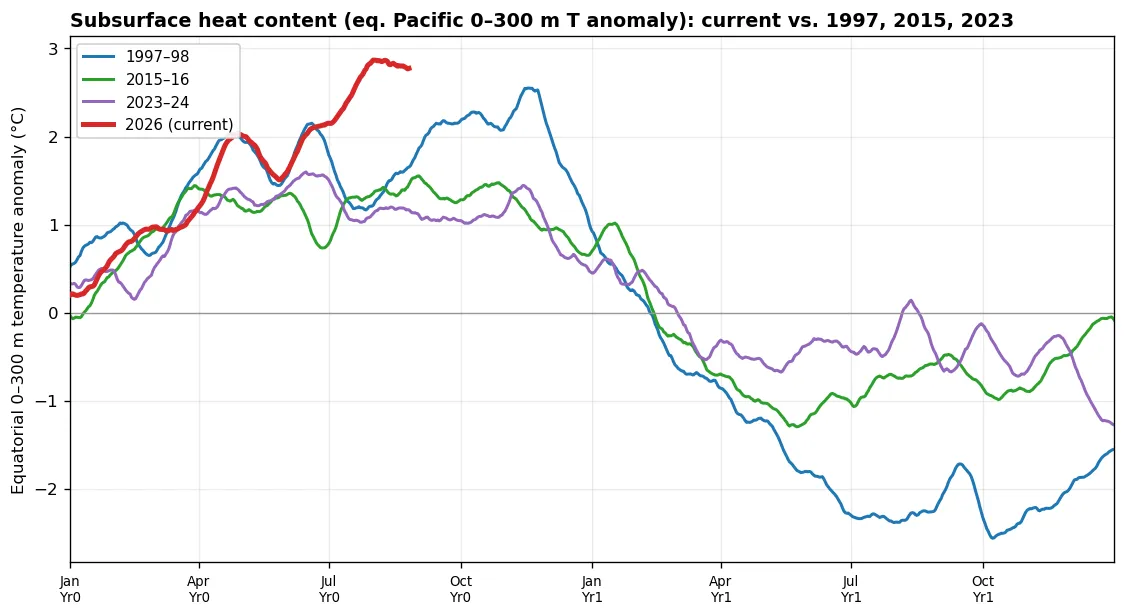
Subsurface Heat Content vs. Analogs
Equatorial Pacific upper-ocean (0–300 m) temperature anomaly (a heat-content proxy that leads the surface) through each event's development year and the next, current (bold red) overlaid on 1997, 2015 and 2023. The subsurface warm reservoir is the fuel for El Niño; watch whether the current build-up keeps pace with the analogs.
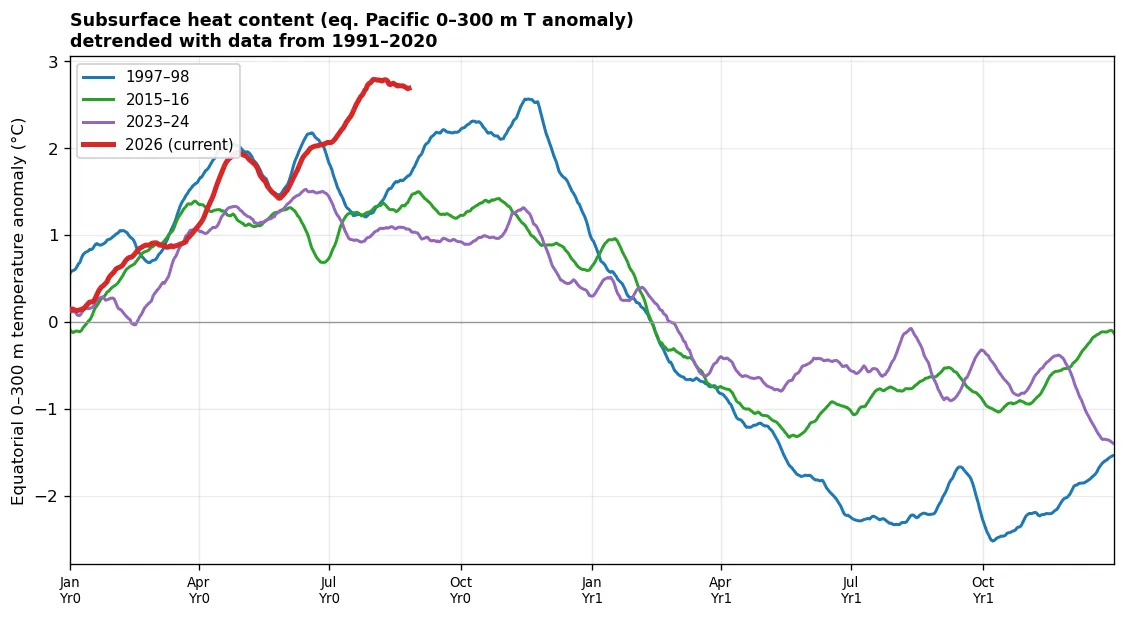
Subsurface Heat Content vs. Analogs: De-trended
The same heat-content comparison with the 1991–2020 climate trend removed, so the four events sit on a common baseline. The net 0–300 m effect is modest (the subsurface warming and cooling trends largely cancel in the column average), but it eases the recent events (2023, current) down relative to 1997.
Subsurface Cross-Section vs. Analogs
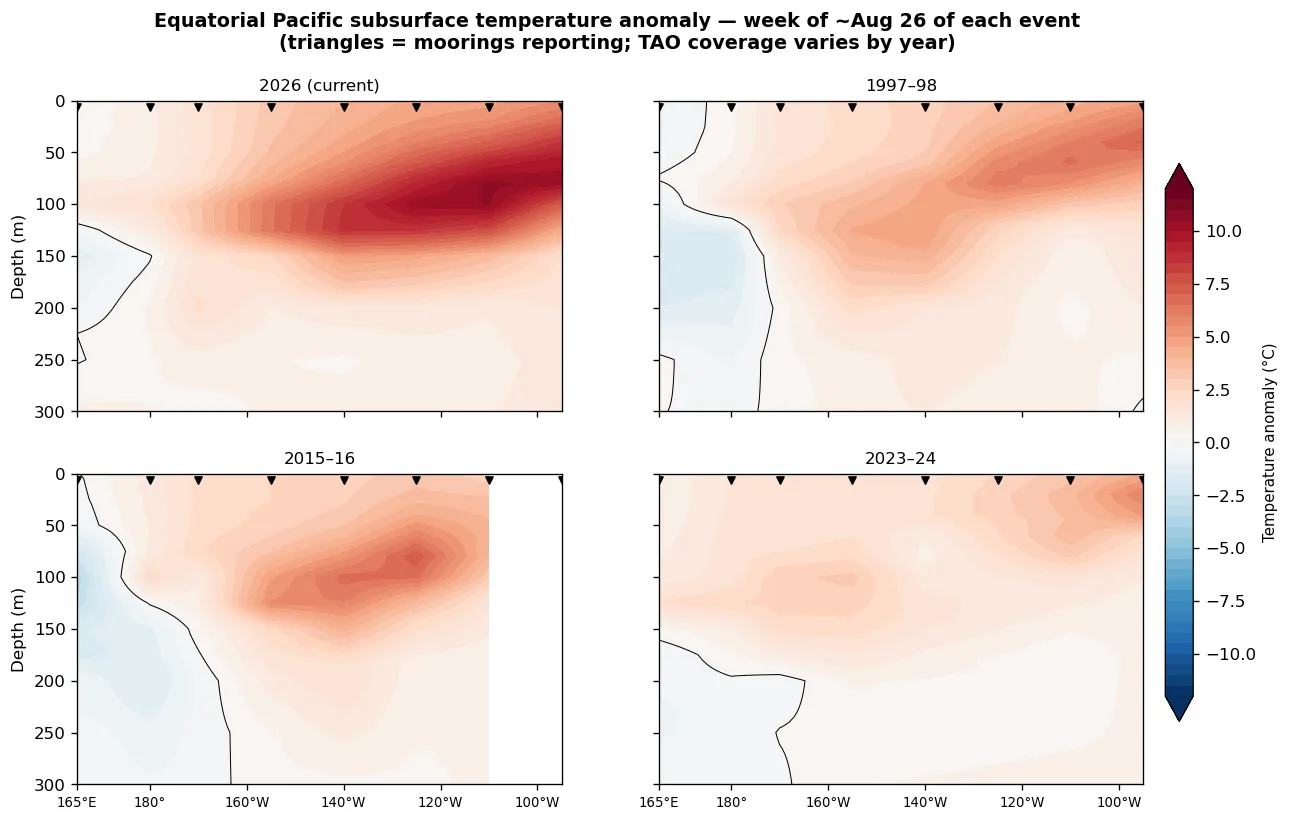
Equatorial depth×longitude temperature anomaly at the same phase (~the latest data week) of each event. The eastward-deepening warm anomaly along the thermocline is the classic El Niño subsurface signature; comparing its depth and intensity against 1997/2015/2023 gauges how loaded the ocean is now.
Note: TAO mooring coverage varies by year (triangles mark moorings reporting), so 1997 and 2023 have missing longitudes.
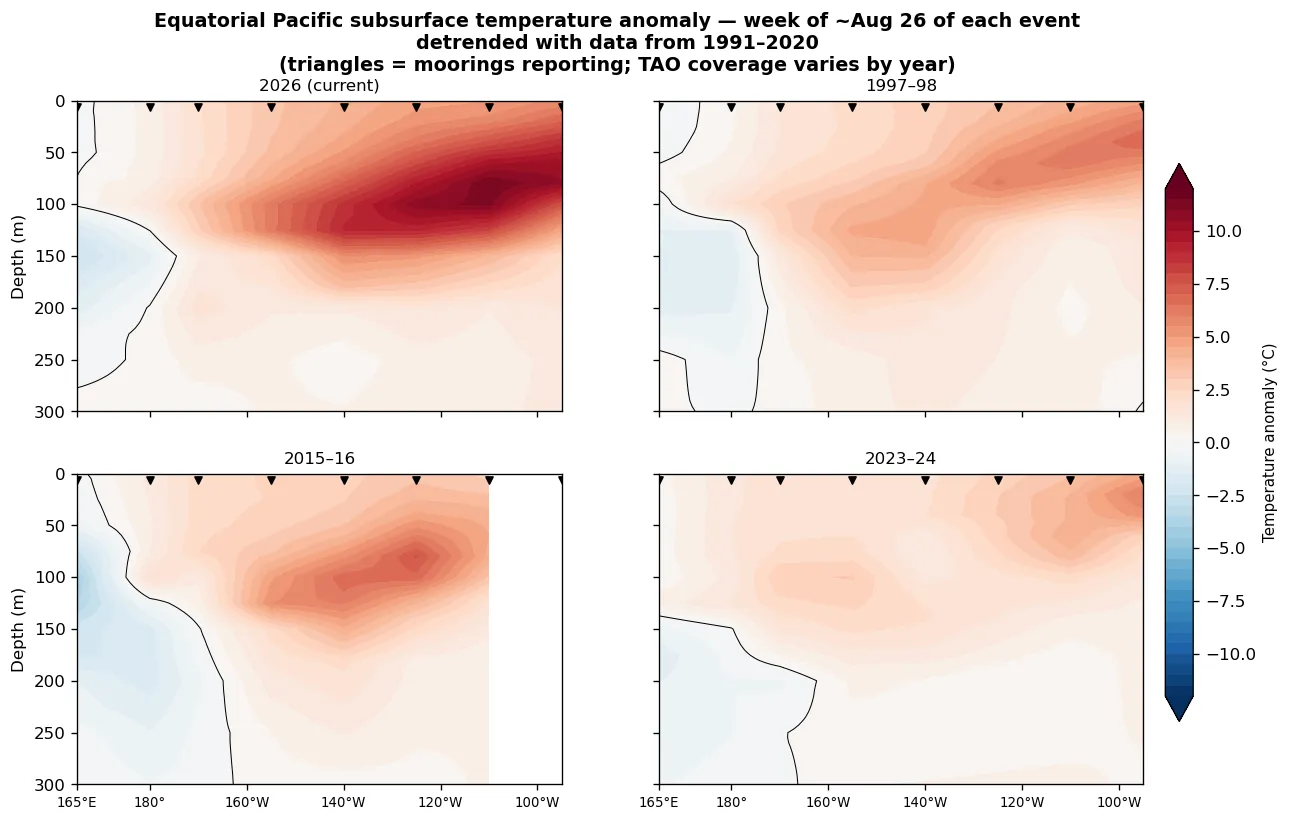
Subsurface Cross-Section vs. Analogs: De-trended
The matching-phase cross-sections with the 1991–2020 climate trend removed. Because the trend has real depth×longitude structure (west-Pacific subsurface warming, eastern-thermocline cooling), de-trending reshapes the pattern more here than in the column-mean heat content above.
Note: TAO mooring coverage varies by year (triangles mark moorings reporting), so 1997 and 2023 have missing longitudes.