Daily, from NOAA OISST v2.1, anomalies against 1991–2020
El Niño monitor
Daily estimates of the Oceanic Niño Index and its warming-era replacement, RONI, ahead of the official monthly numbers — with every Niño region, the tropical background, the satellite view, the equatorial winds and the Southern Oscillation, and the subsurface ocean beneath it all. Computed from source data, updated every morning; one figure at a time, picked from the menu.
← → step through the options · ↑ ↓ change figure · click a still to enlarge

The latest NOAA OISST v2.1 daily field, as anomalies vs 1991–2020 — the raw material behind every index on this page — animated over the last 90 days. Global on top, the tropical Pacific below with the Niño regions outlined; each frame is stamped with that day's ONI / tropical-mean / RONI readout. The panel's buttons also offer two mean-removed variants: the global-mean-removed field, which strips the uniform background warming and isolates the ENSO pattern, and tropics, tropical-mean removed — the whole 30°S–30°N belt with its own 20°S–20°N mean subtracted. That last one is RONI's arithmetic drawn as a map: the same subtraction the index makes at Niño-3.4, applied everywhere, so you can see which basins the Pacific is warm or cool against.
NOAA OISST v2.1 (PSL, NCEI fallback) · 1/4° · anomalies vs 1991–2020 · 90-day animation · daily
Every index is a daily area-weighted SST average, so today's value exists today — no waiting for the month to close. Niño-3.4 is the raw material of ONI; the daily RONI subtracts the 20°S–20°N tropical mean and rescales by the CPC/ECMWF σ-factor, so it reads on ONI's ±0.5 °C thresholds; the 90-day mean is the running daily estimate of ONI itself. Click legend entries to add Niño-1+2 / 3 / 4 and the tropical mean; drag to zoom, double-click to reset.
NOAA OISST v2.1 daily · cosine-weighted box means · base 1991–2020 · RONI scale: per-month σ(ONI)/σ(relative), CPC/ECMWF method
Every index is a daily area-weighted SST average, so today's value exists today — no waiting for the month to close. Niño-3.4 is the raw material of ONI; the daily RONI subtracts the 20°S–20°N tropical mean and rescales by the CPC/ECMWF σ-factor, so it reads on ONI's ±0.5 °C thresholds; the 90-day mean is the running daily estimate of ONI itself. Click legend entries to add Niño-1+2 / 3 / 4 and the tropical mean; drag to zoom, double-click to reset.
NOAA OISST v2.1 daily · cosine-weighted box means · base 1991–2020 · RONI scale: per-month σ(ONI)/σ(relative), CPC/ECMWF method
The same daily-OISST machinery pointed at the other basins. The PDO is the leading pattern of North Pacific SST variability — here as a daily index: each day's anomaly field (global-mean removed) projected onto the ERSST-derived PDO pattern and calibrated to NCEI's published monthly scale. The Indian Ocean Dipole is the west-minus-east tropical Indian Ocean gradient (DMI); events beyond ±0.4 °C shift Australian and East-African rainfall and often lean on ENSO. The Atlantic set tracks the Atlantic Niño (ATL3), the Tropical South Atlantic index, the subtropical dipole (SASD), and the Tropical North Atlantic (TNA) — the box average over 5.5–23.5°N, 57.5–15°W (Enfield convention). The TNA–TSA pair sets the Atlantic ITCZ's position: a warm TNA pulls it north, the classic Nordeste-drought and active-hurricane-season configuration.
NOAA OISST v2.1 daily · base 1991–2020 · PDO pattern: ERSST v5 North Pacific EOF, calibrated to NCEI over 1950–present (r = 0.96) · DMI: Saji boxes · SASD: Morioka poles
NASA JPL's MUR analysis blends infrared, microwave and in-situ SST onto a ~1 km grid — fine enough to resolve the tropical instability wave cusps rolling along the cold-tongue front, the Galápagos wake, and the Peruvian coastal upwelling that the 0.25° OISST maps above smooth over. One frame per day from 1 April 2026 — just before this event's onset (sustained RONI ≥ +0.5 from 21 May) — with a colour range fixed across the whole sequence, so the eastern Pacific visibly warms while the instability waves ripple the front. Click a frame to enlarge it. MUR interpolates under persistent cloud: treat the finest structure as analysis, not direct observation.
NASA JPL MUR SST v4.1 (GHRSST L4) · via NOAA CoastWatch ERDDAP · ~1–2 day latency · daily
The Niño-3.4 box temperature itself, not its anomaly, from NASA JPL's MUR v4.1 analysis, against MUR's own day-of-year climatology (band = p10–p90) and against NOAA OISST v2.1. Absolute rather than anomaly because the Niño-3.4 seasonal cycle is ~2 °C peak-to-peak and an anomaly plot throws it away; here you can read "how warm is it" and "how unusual is that" at once.
This is an independent check, not a second copy of the OISST index: MUR is a GHRSST foundation SST (below the diurnal thermocline) built from a different sensor mix, while OISST v2.1 is a bulk SST anchored to drifting buoys. A steady offset between them is a property of those definitions; the lower panel exists so you can see when the offset moves, which would mean the analyses are disagreeing about the ocean rather than about their own conventions. The offset is small — a few hundredths of a degree with a spread under 0.1 °C; the figure subtitle carries the current value — and they agree closely.
Note: MUR starts in June 2002, so its climatology is 2003–2022. MUR departures are therefore not comparable with the OISST anomalies elsewhere on this site, which use 1991–2020.
NASA JPL MUR v4.1 (GHRSST L4) via NOAA CoastWatch ERDDAP · 5°S–5°N, 170°W–120°W, cos-lat weighted · ~2-day latency
The clouds behind the OLR Hovmöller. NOAA blends GOES-East/West, Himawari and Meteosat into the GMGSI global longwave-IR mosaic on a regular lat/lon grid, so the field is seamless and georeferenced with no stitching or satellite-switch parallax. Looping the last 72 hours; white is cold cloud tops (deep convection). Choose the tropical Pacific crop, or the Americas from southern Mexico and the Caribbean to Tierra del Fuego, spanning the east Pacific and the tropical Atlantic.
NOAA GMGSI longwave-IR global mosaic (GOES-E/W + Himawari + Meteosat) · McIDAS brightness-temperature calibration · hourly, rolling 72 h
150 years of the Southern Oscillation, with today marked against the records. Top: the Bureau of Meteorology's monthly Troup SOI computed one way from 1876 to the present — monthly (light) and 3-month mean (bold), with dotted record lines: the all-time monthly extremes were set in Apr 1905 (−42.6) and Aug 1917 (+34.8). Middle: the consistent daily record — LongPaddock's daily Troup index (10·(ΔP − m)/σ, ΔP = Tahiti − Darwin MSLP, fixed 1887–1989 base), June 1991–present, as 30-day and 90-day running means with their own record max/min lines (1997–98 holds the 30-day minimum; 2010–11 the positive records). Bottom: the last 24 months with raw daily values as bars. Sustained values below −8 are the classic Troup El Niño threshold; the record lines show at a glance how the current excursion ranks in a century and a half of data.
Queensland Govt LongPaddock / BoM daily Troup SOI · fixed 1887–1989 base · updated each cycle
NOAA PSL's Multivariate ENSO Index v2 is the leading combined-EOF of five tropical-Pacific fields (sea-level pressure, SST, surface zonal and meridional wind, and OLR), but it is published only as an overlapping bimonthly value with a roughly five-week lag. This is a daily nowcast of it: a regression of the published MEI.v2 onto freely-available daily ENSO components (the Niño-3.4 SST anomaly, the Southern Oscillation Index, and the equatorial 850-hPa zonal wind), driven forward each day. The grey steps are the official bimonthly MEI.v2; the red line is the daily estimate, with a ±0.30 leave-one-year-out cross-validation band (the fit reproduces MEI.v2 at R = 0.94). The model is SST-weighted, so during a fast SST-led transition it can lead MEI's slower atmospheric components.
Regression on NOAA OISST Niño-3.4 · SOI (BoM) · ERA5 eq-u850 · target: NOAA PSL MEI.v2
A longitude × time Hovmöller of deep convection along the equator. NOAA's interpolated-OLR product ended in 2022, so this derives an OLR proxy in real time from the GMGSI global longwave-IR satellite mosaic: the IR brightness temperature (cold cloud tops) is converted to outgoing longwave radiation, and the 5°S–5°N zonal mean is stacked over time. Yellow to red is low OLR (deep convection); blue is high OLR (suppressed or clear sky). An eastward (top to bottom-right) tilt is the MJO propagating east; convection parked at the dateline reflects the El Niño-shifted warm pool. Newest day at the bottom.
NOAA GMGSI longwave-IR global mosaic · McIDAS T_b + Ohring-Gruber OLR · 5°S–5°N daily mean
A longitude × time Hovmöller of the equatorial outgoing-longwave-radiation (OLR) anomaly, averaged 5°S–5°N around the globe. OLR is derived in real time from the GMGSI longwave-IR mosaic (McIDAS brightness temperature to OLR), with the anomaly taken against NOAA's interpolated-OLR daily climatology (1979–2022). The shaded field is the total anomaly: green is low OLR (deep convection), brown is high OLR (suppressed).
Each overlaid component is isolated from that anomaly field and contoured at its convective (solid) and suppressed (dashed) phase. Kelvin, MJO and equatorial Rossby are Wheeler–Kiladis wavenumber–frequency bandpass filters of the anomaly (2-D FFT in longitude and time): Kelvin is eastward wavenumber 1–14, period 2.5–30 d, equivalent depth 8–90 m; MJO is eastward wavenumber 1–5, period 30–96 d; ER is westward wavenumber 1–10, period 9.7–48 d. Low-frequency is a 120-day Lanczos low-pass in time with the zonal mean removed.
GMGSI longwave-IR proxy · Wheeler–Kiladis k–ω filtering (eq. depth 8–90 m) · climatology NOAA interp-OLR 1979–2022
Each wave isolated in its own panel — the Kelvin-filtered (5°S–5°N) and equatorial-Rossby-filtered (15°S–15°N, n=1) OLR anomaly as shading — with the active enhanced-convection packets tracked: the band's recent phase speed is fitted by day-to-day lag correlation of the filtered field, today's packet centres are located, and each characteristic is extrapolated ahead at that speed (dotted line). Below the dashed today-line the shading is a true forecast: the AIFS-ENS ensemble-mean precipitation (as a pseudo-OLR, standardized against an ERA5 1991–2020 band climatology) is appended to the record and run through the same Wheeler–Kiladis filter, so the wave field continues with the model's dynamics — where the dotted constant-speed line and the model streaks agree, confidence in the arrival time is high.
Same GMGSI OLR proxy + Wheeler–Kiladis filters as above · phase speed from lag-1-day circular cross-correlation (last 15 days) · forecast strip: AIFS-ENS ens-mean precip pseudo-OLR, identically filtered (falls back to constant-speed extrapolation if no cycle is cached)
Copernicus Marine WIND_GLO_PHY_L4_NRT (scatterometer / ASCAT) · ~1–2 day latency · updated daily · drag the slider for recent days
Longitude × time strip of the daily-mean surface zonal wind averaged 5°S–5°N, 150°E–90°W, from the same gap-filled scatterometer (ASCAT) L4 product as the map above. Red is westerly (El Niño-favorable), blue is easterly (the trade winds). Westerly-wind bursts (red) over the warm pool force the downwelling Kelvin waves and eastward surface-current surges seen on the subsurface page. Newest day at the bottom.
Copernicus Marine WIND_GLO_PHY_L4_NRT (scatterometer / ASCAT) · 5°S–5°N daily mean · rolling ~9 months · updated daily
The Southern Oscillation Index is a Troup standardisation of the Tahiti-minus-Darwin sea-level-pressure difference. It is published only monthly, and even LongPaddock's daily version lags 1–2 days. This estimates it in near-real time from the hourly QNH in the Darwin (YPDN) and Tahiti / Faa’a (NTAA) airport METARs, updated hourly by a GitHub Action.
The exact formula (Troup, 1965):
SOI = 10 × ( Pdiff − Pdiff ) ÷ σdiff
where Pdiff = mean-sea-level pressure at Tahiti minus Darwin (monthly mean), Pdiff is the long-term average of that difference for the given calendar month, and σdiff its standard deviation, both taken over the 1887–1989 base period. The factor of 10 is Troup’s scaling (so the index mostly falls within ±35). Crucially, σdiff is the spread of monthly values (≈1.3–2.1 hPa), not the much wider day-to-day spread; the exact monthly mean and σ are recovered by regressing LongPaddock’s published SOI against its own Tahiti−Darwin pressure record, then applied to the live METAR pressures.
The grey line is the published LongPaddock daily SOI; the bold red line is the 24-hour-mean estimate, nudged onto the LongPaddock scale, which runs a day or two ahead of it. The faint blue line is the raw hourly SOI, very noisy (the semidiurnal pressure tide, passing weather, and 1-hPa METAR rounding). Negative is El Niño-favorable.
Darwin (YPDN) + Tahiti (NTAA) METAR via aviationweather.gov · Troup normals & calibration from LongPaddock (BoM 1887–1989 base) · updated hourly
Extending the observed SOI forward: the same Troup SOI (the standardized Tahiti−Darwin sea-level-pressure difference), here forecast from the combined AIFS-ENS + IFS-ENS ensemble (about 100 members). Observed values are from LongPaddock (Queensland Govt / BoM); the forecast is the Tahiti−Darwin MSL from the ensembles, bias-corrected to the recent observed level. Bold lines are the 30-day running SOI; the faint daily series and shaded 10–90% band show the day-to-day spread. Sustained negative SOI (below −7) is El Niño-favorable; sustained positive (above +7) is La Niña-favorable.
LongPaddock daily SOI (BoM, 1887–1989 base) · forecast: ECMWF AIFS-ENS + IFS-ENS MSL · updated each 00/12Z cycle
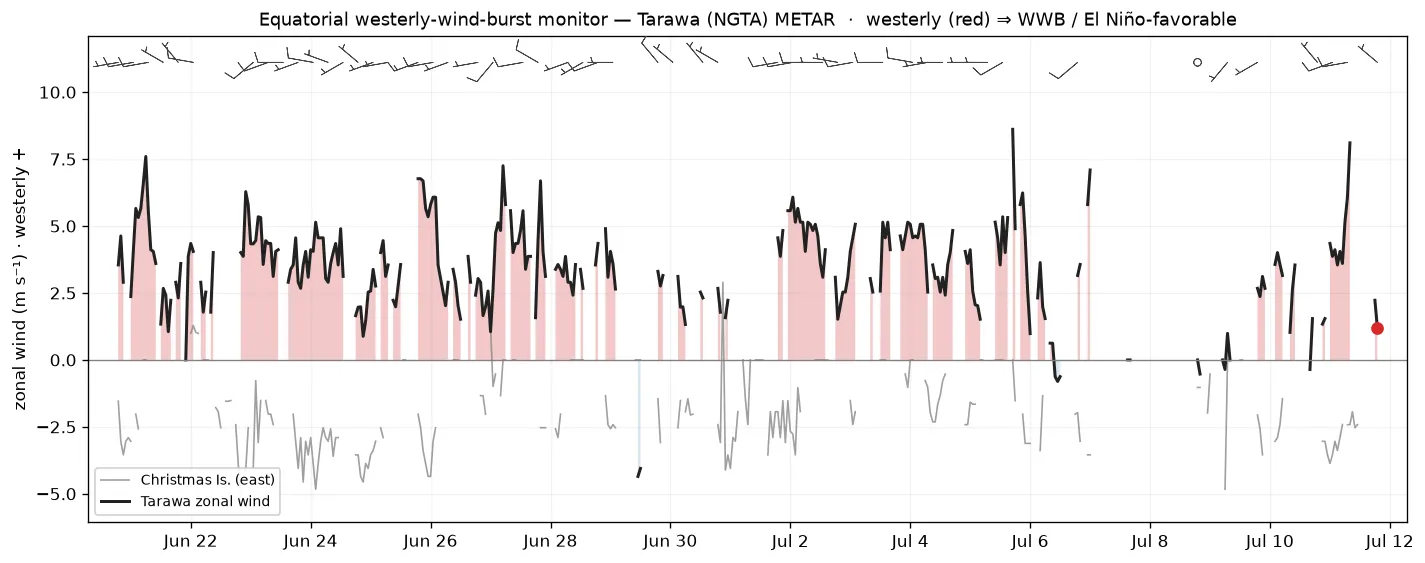
Westerly wind bursts (WWBs) over the west-central equatorial Pacific are a key El Niño trigger: the easterly trades briefly reverse to westerly, pushing warm water and convection eastward and forcing downwelling Kelvin waves. Tarawa / Bonriki (NGTA, 1.4°N 173°E) sits in that zone, so its hourly airport wind is a live proxy, with Christmas Island (PLCH, far to the east) shown for contrast. The arrows show the latest wind at each station (red is westerly, blue is easterly); the chart tracks the zonal wind component at Tarawa, where a sustained red excursion is an active WWB.
Tarawa / Bonriki (NGTA) + Christmas Is. / Kiritimati (PLCH) METAR via aviationweather.gov · updated hourly
Tarawa’s daily airport wind from 1 April onward through recent El Niño onset years, 2015–16 (very strong) and 2023–24 (weaker), against the current year, from the Iowa Environmental Mesonet METAR archive. Both panels are a 7-day running mean of the hourly obs: top is zonal wind (westerly positive); bottom is the fraction of each day with westerly winds. In a developing El Niño the easterly trades weaken and westerly bursts become more frequent, so both climb from the cold-state baseline.
Tarawa (NGTT/NGTA) METAR · Iowa Environmental Mesonet ASOS archive · monthly zonal wind & westerly fraction · refreshed daily
Forecast 10 m zonal-wind anomaly (5°S–5°N), longitude × forecast day, from the AIFS-ENS (AI) and ECMWF IFS-ENS (physics) ensemble means versus the ERA5 1991–2020 climatology. Westerly (red) anomalies along the equator favor El Niño development; easterly (blue) anomalies favor La Niña. Agreement between the AI and physics ensembles raises confidence.
ECMWF AIFS-ENS & IFS-ENS (open data) · anomaly vs ERA5 1991–2020 · updated each 00/12Z cycle
Depth–longitude cross-section along the equator (0°N) from the TAO/TRITON moored-buoy array: temperature (top) and its anomaly versus the 1991–2020 average (bottom), 5-day smoothed. The thermocline (here the 26°C and 28°C isotherms, with the 20°C isotherm — the standard thermocline proxy — in heavy solid black) tilts upward toward the east, and subsurface anomalies along it often lead the surface ENSO signal. The 10°C isotherm is drawn dashed blue whenever it enters the section.
NOAA/PMEL TAO/TRITON (DISDEL) · base 1991–2020 · 120-day animation, latest shown
Equatorial Pacific upper-ocean (0–300 m) temperature anomaly — a heat-content proxy that leads the surface — through each event's development year and the next, current (bold red) over 1997, 2015 and 2023. The subsurface warm reservoir is the fuel for El Niño. De-trended removes the 1991–2020 climate trend so the four events sit on a common baseline; the net 0–300 m effect is modest because the subsurface warming and cooling trends largely cancel in the column average.
NOAA/PMEL TAO/TRITON moorings · anomaly vs 1991–2020 · coverage varies by year
Equatorial depth×longitude temperature anomaly at the same phase (~the latest data week) of each event. The eastward-deepening warm anomaly along the thermocline is the classic El Niño subsurface signature. De-trended reshapes the pattern more than it does the column-mean heat content above, because the trend itself has depth×longitude structure (west-Pacific subsurface warming, eastern-thermocline cooling). TAO coverage varies by year (triangles mark reporting moorings), so 1997 and 2023 have missing longitudes.
NOAA/PMEL TAO/TRITON moorings · anomaly vs 1991–2020 · 14-day mean · coverage varies by year
Daily surface-current fields over the last month for the equatorial Pacific (15°S–15°N, 130°E–80°W) from the Copernicus Marine 1/12° ocean model: speed shaded (blue slow to red fast) with streamlines tracing the flow. The westward South Equatorial Current straddles the equator, the eastward North Equatorial Counter Current sits near 5–10°N, and Tropical Instability Wave eddies ripple along the cold tongue.
Copernicus Marine GLOBAL_ANALYSISFORECAST_PHY_001_024 (1/12°) · surface (~0.5 m)
Depth–longitude slice along the equator (1.5°S–1.5°N), 160°E–90°W, from the Copernicus Marine 1/12° global ocean model: zonal current (shaded, eastward in red) with the 20°C isotherm (the thermocline) in black. It resolves the Equatorial Undercurrent, the eastward subsurface jet at about 50–200 m, the surface-westward South Equatorial Current, and the east–west thermocline tilt. The loop is pinned to start 1 March 2026 and grows daily, so downwelling Kelvin waves (a deepening of the 20°C isotherm with an eastward current pulse) can be followed across the basin.
Copernicus Marine GLOBAL_ANALYSISFORECAST_PHY_001_024 (1/12° Mercator) · equator 1.5°S–1.5°N mean · since 1 Mar 2026
Longitude × time strip of the daily surface zonal current averaged 2°S–2°N, 150°E–90°W (same Copernicus Marine model). Red is eastward, blue is westward. The equatorial surface normally flows westward (the trade-driven South Equatorial Current); as El Niño matures, downwelling Kelvin waves drive eastward surges into the east Pacific. Newest day at the bottom.
Copernicus Marine GLOBAL_ANALYSISFORECAST_PHY_001_024 (1/12°) · 2°S–2°N surface mean · rolling ~9 months
The Equatorial SOI is CPC’s zonal pressure index for the equatorial Pacific: the standardised anomaly of the area-mean sea-level pressure over the eastern equatorial Pacific (5°N–5°S, 130–80°W) minus that over Indonesia (5°N–5°S, 90–140°E). It measures the pressure gradient that drives the equatorial trades directly, on the equator, where the classic Tahiti–Darwin SOI samples two stations well off it; the two agree closely in the mean but the equatorial index is less noisy and more physically tied to the Walker circulation. Negative values go with El Niño.
Here the box means are taken from the AIFS-ENS and IFS-ENS sea-level pressure forecasts (control and perturbed members, days 1–15), standardised with ERA5 1991–2020 per-month statistics of the monthly-mean box difference, then placed on CPC’s scale by a linear fit to CPC’s published monthly series over 1991–2020 (r = 0.94, slope 0.94). The bars are CPC’s monthly values; the black tail is the day-1 ensemble mean archived each cycle, a stand-in for a daily analysis until a proper one is added. Daily values scatter more than the monthly index they are drawn against.
NOAA CPC Equatorial SOI (reqsoi.for) · ECMWF AIFS-ENS and IFS-ENS MSL (open data, CC BY 4.0) · ERA5 1991–2020 standardisation · updated each 00/12Z cycle
ECMWF SEAS5’s 51 members carried through the coming six months as the Southern Oscillation Index (Tahiti minus Darwin) and CPC’s Equatorial SOI (east-minus-west equatorial box pressure), in seasonal standard deviations. The calibrated view regresses CPC’s observed index on the model’s ensemble mean over the 1993–2016 hindcast, lead by lead: the mean is shrunk or stretched to the model’s demonstrated skill and the band is the residual spread (10–90% and 25–75%), so a lead with no skill shows climatology rather than a confident wrong answer. The raw view is the members as they come. CPC’s last four monthly values are drawn in black.
ECMWF SEAS5 via the Copernicus Climate Data Store (issue from the SEAS5 page) · NOAA CPC SOI and Equatorial SOI · calibration: 1993–2016 hindcast, 24 years