Home › Explainers › Sudden stratospheric warmings
Sudden stratospheric warmings and the polar vortex
Also called: SSW, sudden stratospheric warming, major SSW, polar vortex, polar vortex split, vortex displacement
A sudden stratospheric warming (SSW) is the collapse of the winter polar vortex: planetary waves rising from the troposphere decelerate the stratospheric westerlies until they reverse, and the polar stratosphere warms by tens of degrees within days. The usual definition (Charlton and Polvani, 2007) is the first day in November–March on which the zonal-mean zonal wind at 60°N and 10 hPa turns easterly. A second event in the same winter must be separated by 20 consecutive westerly days, and a reversal that never recovers before spring is the final warming, not an SSW.
Splits and displacements
Seen from above, the vortex either shifts off the pole (a displacement, driven mostly by zonal wavenumber 1) or breaks into two separate lows (a split, driven by wavenumber 2). Splits tend to be more abrupt and to reach deeper into the lower stratosphere.
How they reach the surface
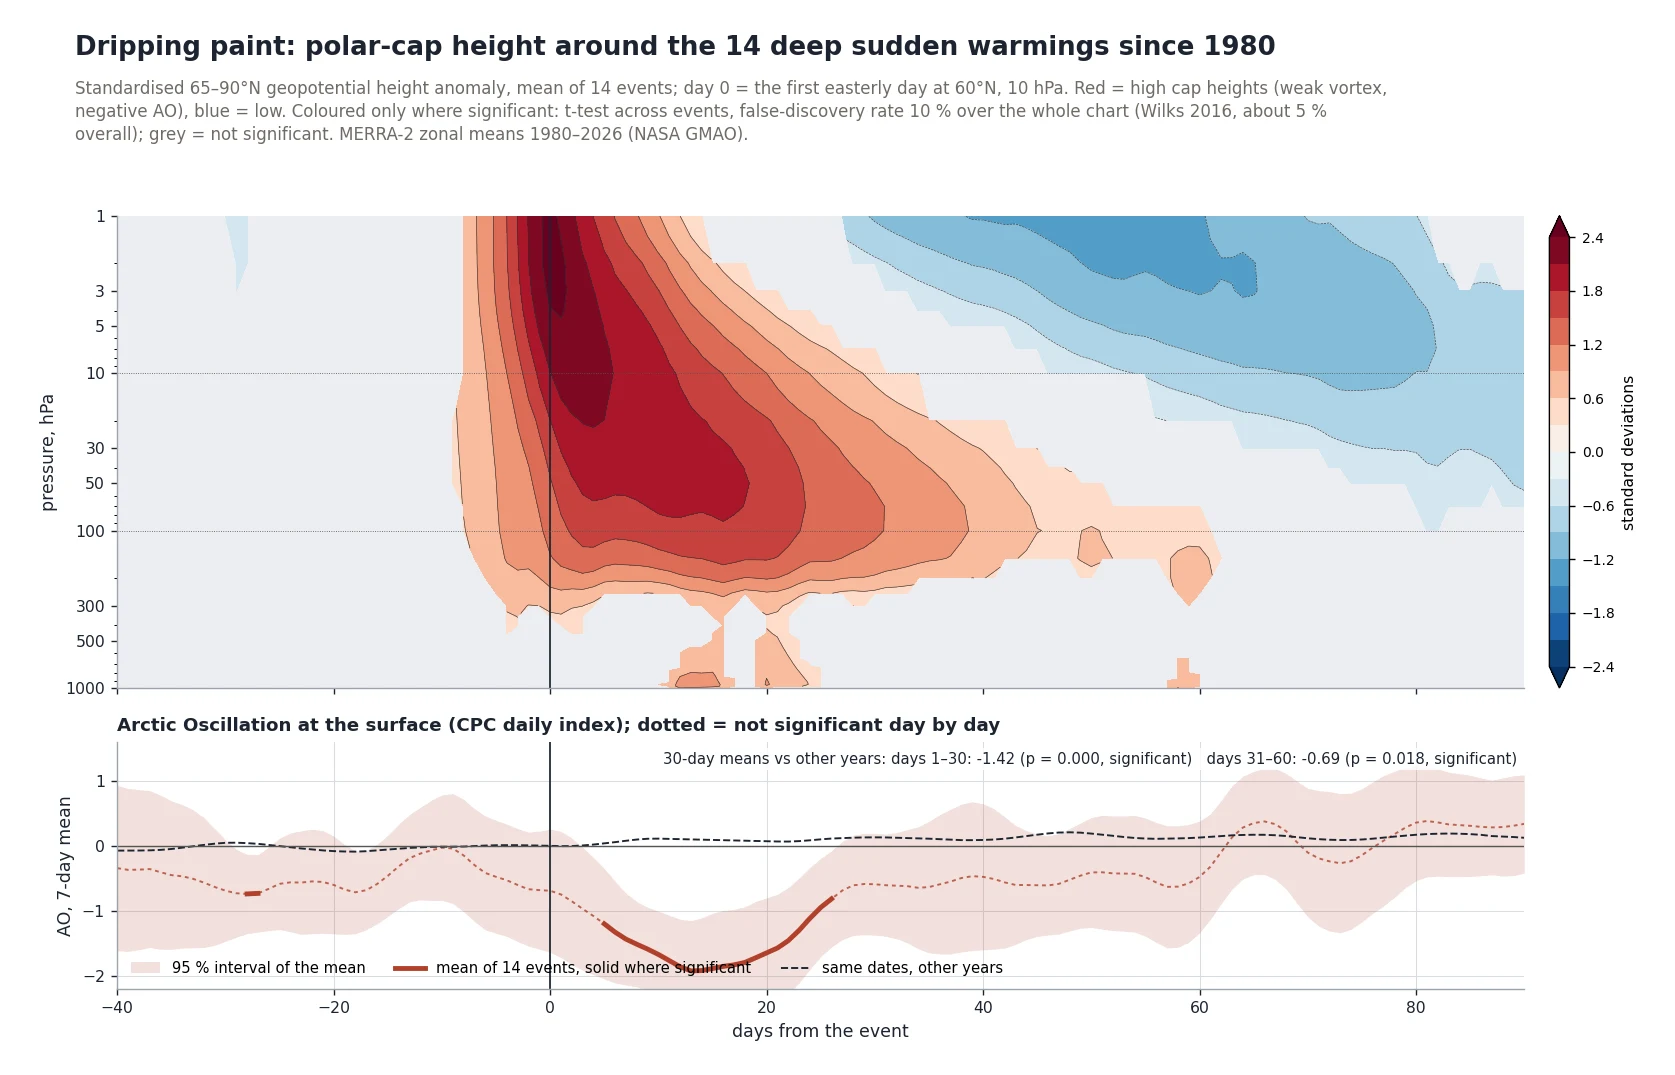
Baldwin and Dunkerton (2001) showed that large stratospheric anomalies work their way down over a few weeks and then hold the surface in the same state for one to two months. Drawn against time and height the composite looks like paint dripping down a wall. After a warming that reaches the lower stratosphere, the Arctic Oscillation and North Atlantic Oscillation tend to turn negative, bringing cold air into northern Eurasia and eastern North America.
Every warming since 1980
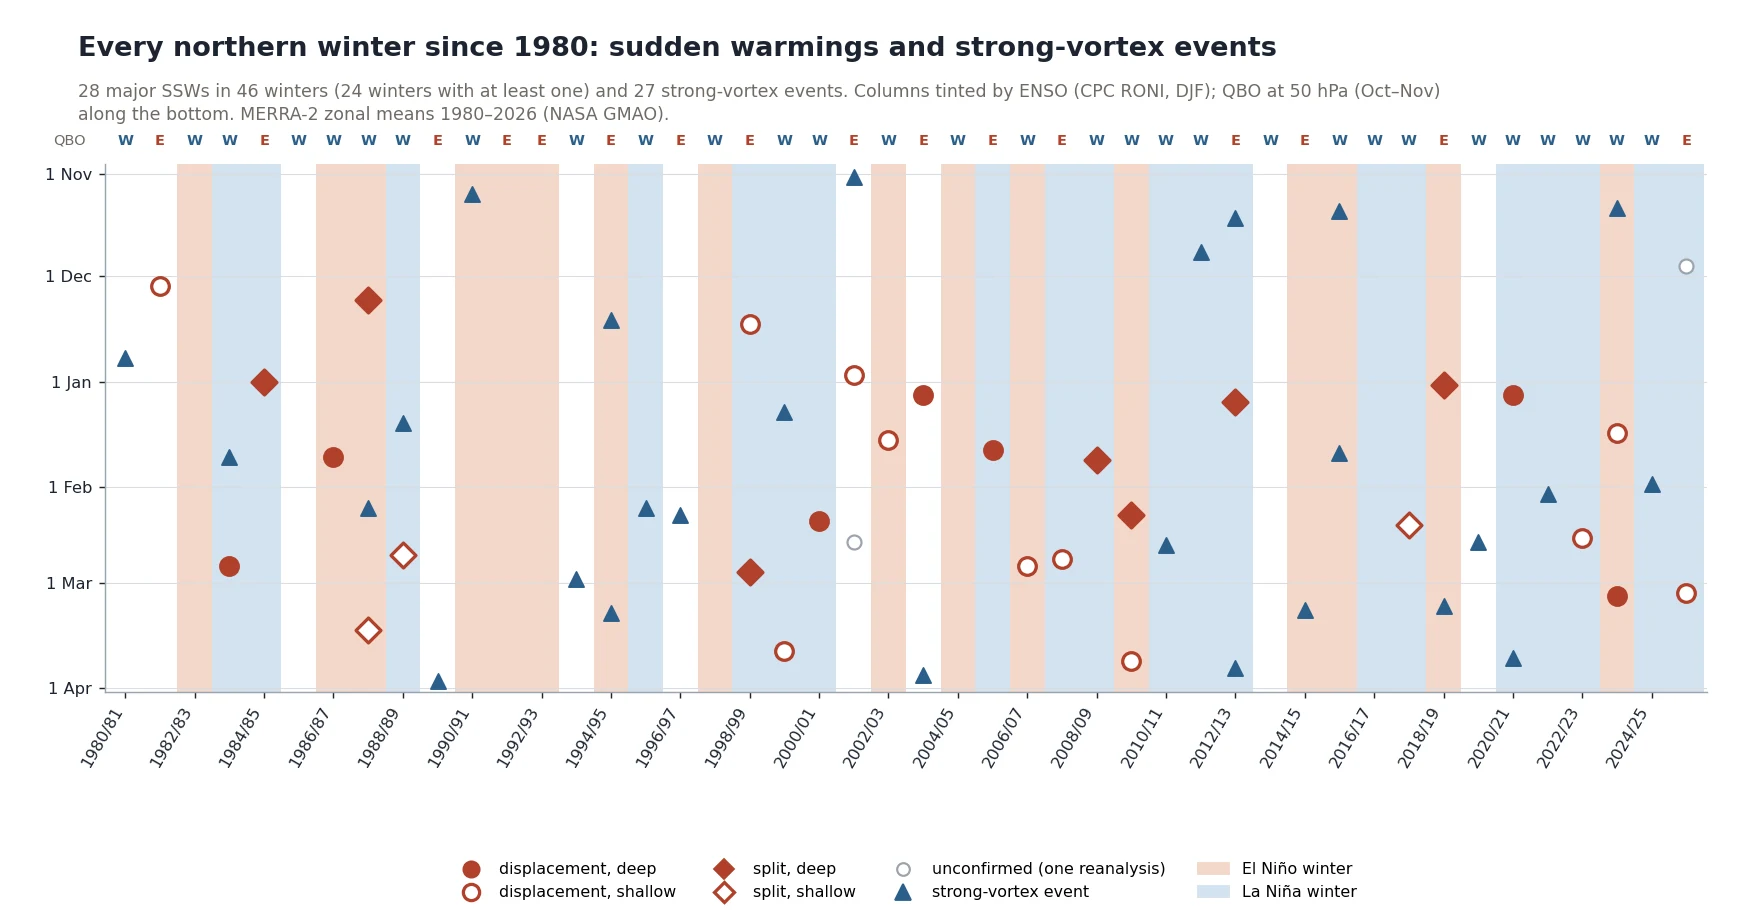
This site's catalogue, built from NASA's MERRA-2 reanalysis, finds 28 major warmings in 24 of the 46 winters since 1980, 10 of them splits. The events are split into deep and shallow by how strong the anomaly is at 100–150 hPa over the following month. After the 14 deep events the Arctic Oscillation averaged 1.42 below the same dates in other years over days 1–30, and 0.69 below over days 31–60. Both differences are significant (t-test, false-discovery rate 10 %). After the 14 shallow events there was no significant change.
The live forecast
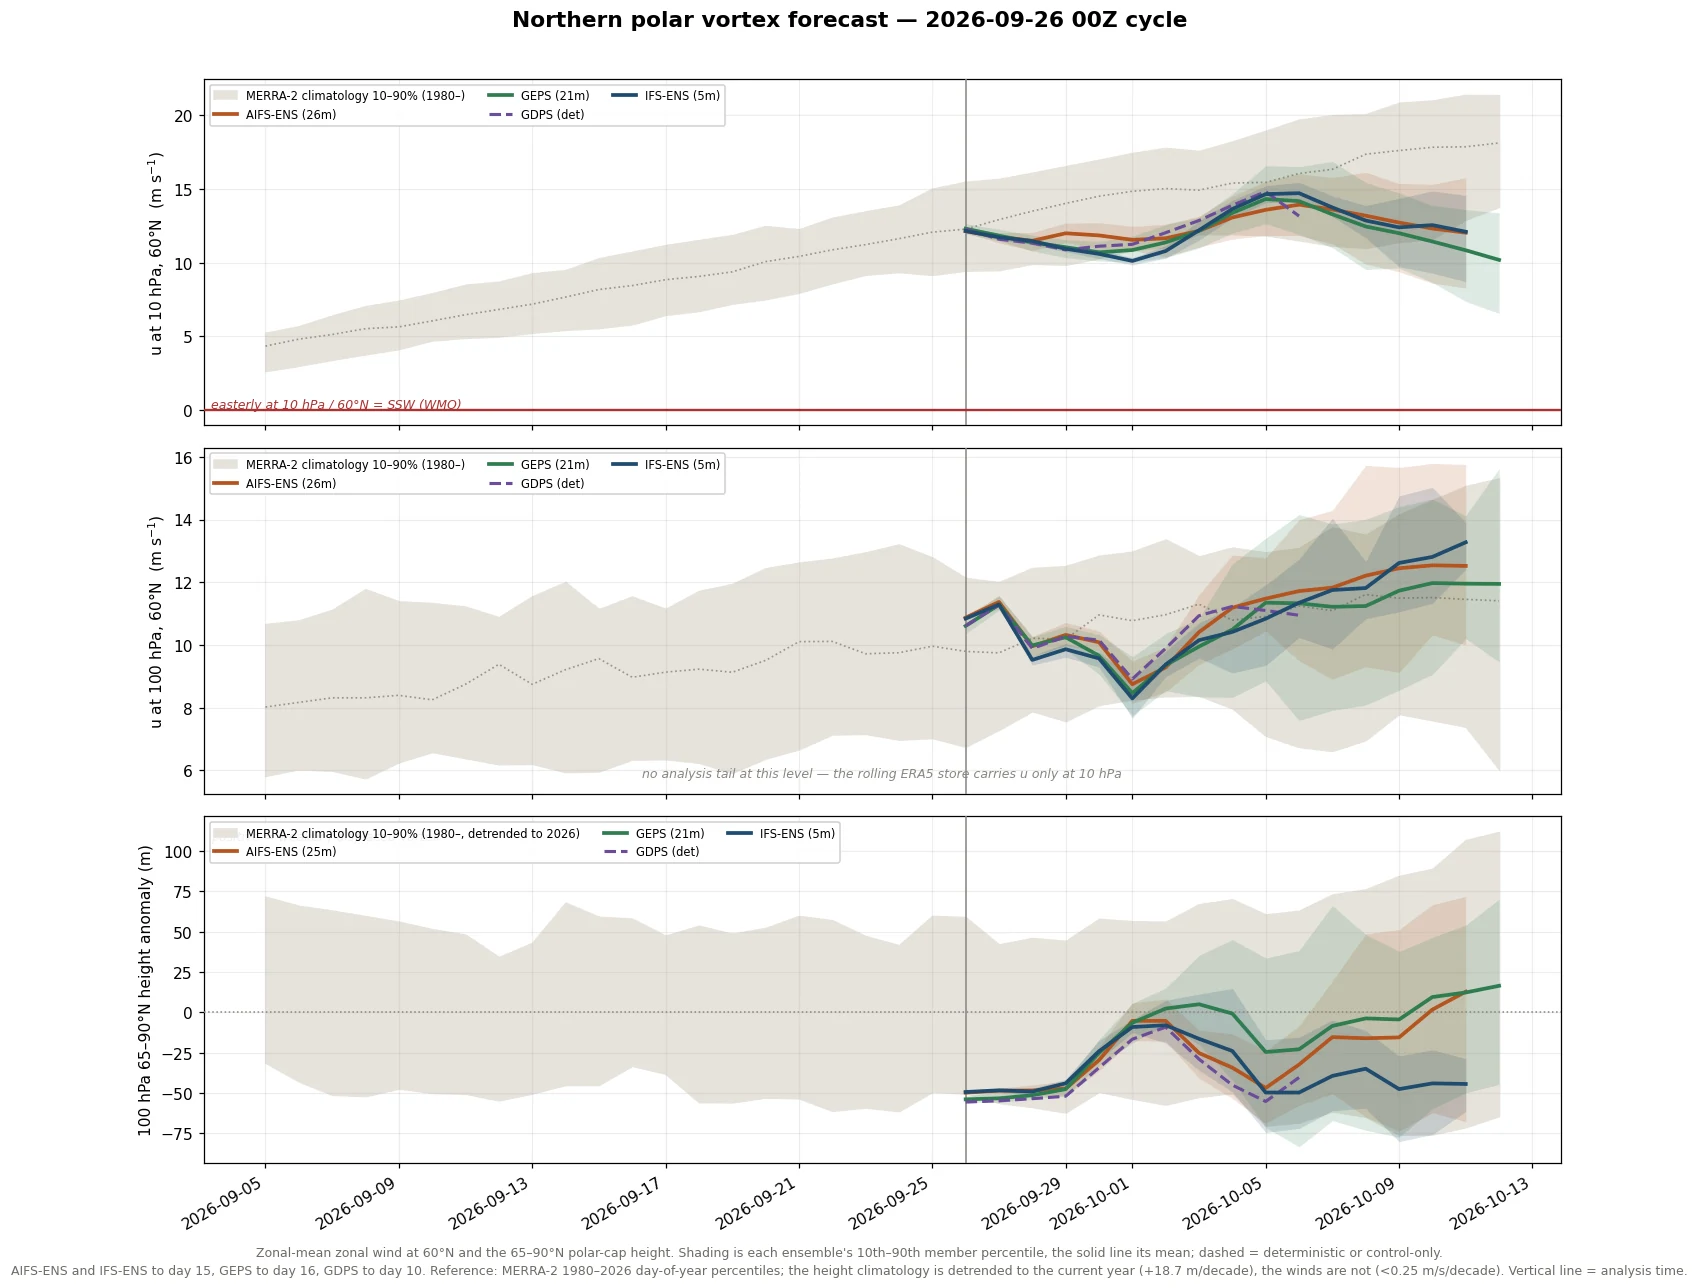
The vortex chart tracks the zonal-mean wind at 60°N at 10 and 100 hPa and the polar-cap height at 100 hPa for every AIFS ensemble member against the MERRA-2 percentile bands, so that the fraction of members reversing the wind (a forecast major warming) can be read directly.
Open the polar vortex forecast and the SSW history on the stratosphere page